Operational Lake Rule Band
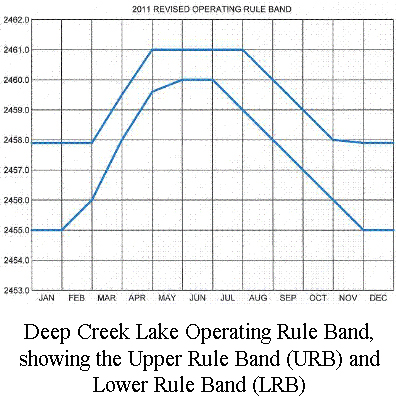 To support recreation on Deep Creek Lake, lake levels should be maintained
above elevation 2,458 ft. from early May through mid-October. Drawdown
also should be limited each month to permit adjustment of boat docks.
To minimize the potential for erosion of sensitive lake shoreline areas,
lake levels should not exceed 2461.0 ft. To reduce the potential for entrainment
of walleye and perch fry, generation during the early spring should be
minimized. To maintain power and energy benefits, the project should continue
to operate as a peaking plant, available to generate a minimum of two
hours per day on any given week day. Generation is normally scheduled
during weekdays to take advantage of relatively higher power values. The
figure to the right illustrates the current rule band for operating the
project to maintain the desired lake levels to achieve these objectives.
To support recreation on Deep Creek Lake, lake levels should be maintained
above elevation 2,458 ft. from early May through mid-October. Drawdown
also should be limited each month to permit adjustment of boat docks.
To minimize the potential for erosion of sensitive lake shoreline areas,
lake levels should not exceed 2461.0 ft. To reduce the potential for entrainment
of walleye and perch fry, generation during the early spring should be
minimized. To maintain power and energy benefits, the project should continue
to operate as a peaking plant, available to generate a minimum of two
hours per day on any given week day. Generation is normally scheduled
during weekdays to take advantage of relatively higher power values. The
figure to the right illustrates the current rule band for operating the
project to maintain the desired lake levels to achieve these objectives.
Back to Top
Improved River Water Quality
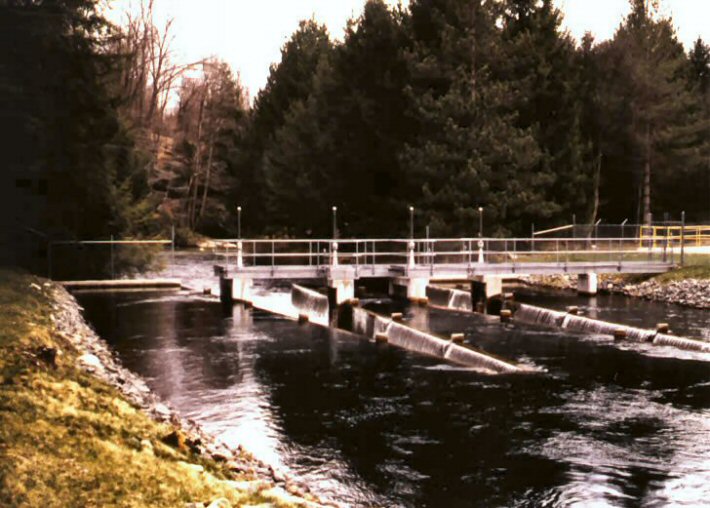 Releases of water from the Deep Creek Station can have a pronounced impact
on dissolved oxygen (DO) in the Youghiogheny River, particularly during
the summer months (figure). A feasibility study was conducted
in the early 1990's of alternative ways to meet Maryland DO standards
and identified a tailrace weir and an oxygen injection system as the most
promising alternatives. The tailrace weir was determined to be the most
practical and cost-effective solution to correct the DO problem. The tailrace
weir, basically a small waterfall which aerates the water after discharge
from the power plant, was constructed and ready for operation in December
1994. It is shaped like a "W" to provide the required 430 length
needed for aeration within the 40 foot tailrace channel. It is 8.4 feet
high and results in a reduction in energy production of about 1% due to
headloss. Results show that it is very effective at improving DO in the
tailrace at startup. Even with a discharge DO level of less than 0.5 parts
per million (ppm), the tailrace DO was never lower than 4.9 ppm. Uptake
rates of DO ranged from 0.5 to 4.5 ppm, depending on the discharge DO
level.
Releases of water from the Deep Creek Station can have a pronounced impact
on dissolved oxygen (DO) in the Youghiogheny River, particularly during
the summer months (figure). A feasibility study was conducted
in the early 1990's of alternative ways to meet Maryland DO standards
and identified a tailrace weir and an oxygen injection system as the most
promising alternatives. The tailrace weir was determined to be the most
practical and cost-effective solution to correct the DO problem. The tailrace
weir, basically a small waterfall which aerates the water after discharge
from the power plant, was constructed and ready for operation in December
1994. It is shaped like a "W" to provide the required 430 length
needed for aeration within the 40 foot tailrace channel. It is 8.4 feet
high and results in a reduction in energy production of about 1% due to
headloss. Results show that it is very effective at improving DO in the
tailrace at startup. Even with a discharge DO level of less than 0.5 parts
per million (ppm), the tailrace DO was never lower than 4.9 ppm. Uptake
rates of DO ranged from 0.5 to 4.5 ppm, depending on the discharge DO
level.
Back to Top
Enhanced River Fisheries
Many variables have affected trout populations numbers in the Youghiogheny
River since 1987 when the Department of Natural Resources began sampling. These factors include drought
summers (e.g., 1987, 1988, 1991, 1999), variable stocking rates, unknown
harvest, the catch and release regulations implemented in 1993, and the
habitat temperature enhancement measures implemented in 1995. However,
standing crop estimates indicate an improving population at Hoyes Run.
Measurements at Sang Run are more uncertain due to greater difficulty
in sampling in that portion of the river.
Back to Top
Temperature Habitat Enhancement
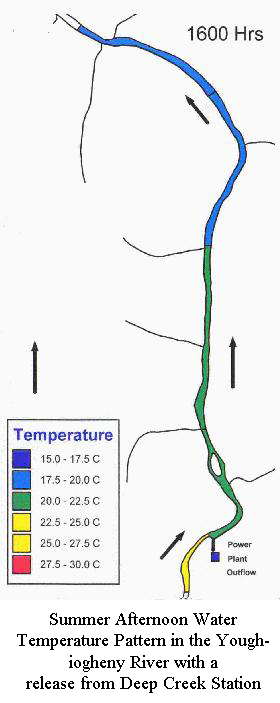 The temperature enhancement protocol was formally implemented in the
summer of 1995. The figure to the left shows river temperatures on a typical
hot summer day when releases from Deep Creek Station keep the water cool.
A report evaluating results for 1995 through 2008 is available,
The temperature enhancement protocol was formally implemented in the
summer of 1995. The figure to the left shows river temperatures on a typical
hot summer day when releases from Deep Creek Station keep the water cool.
A report evaluating results for 1995 through 2008 is available,  Youghiogheny
River Temperature Enhancement Protocol for Operating Deep Creek Hydroelectric
Station: Model Development and Results for 1995-2008.
Youghiogheny
River Temperature Enhancement Protocol for Operating Deep Creek Hydroelectric
Station: Model Development and Results for 1995-2008.
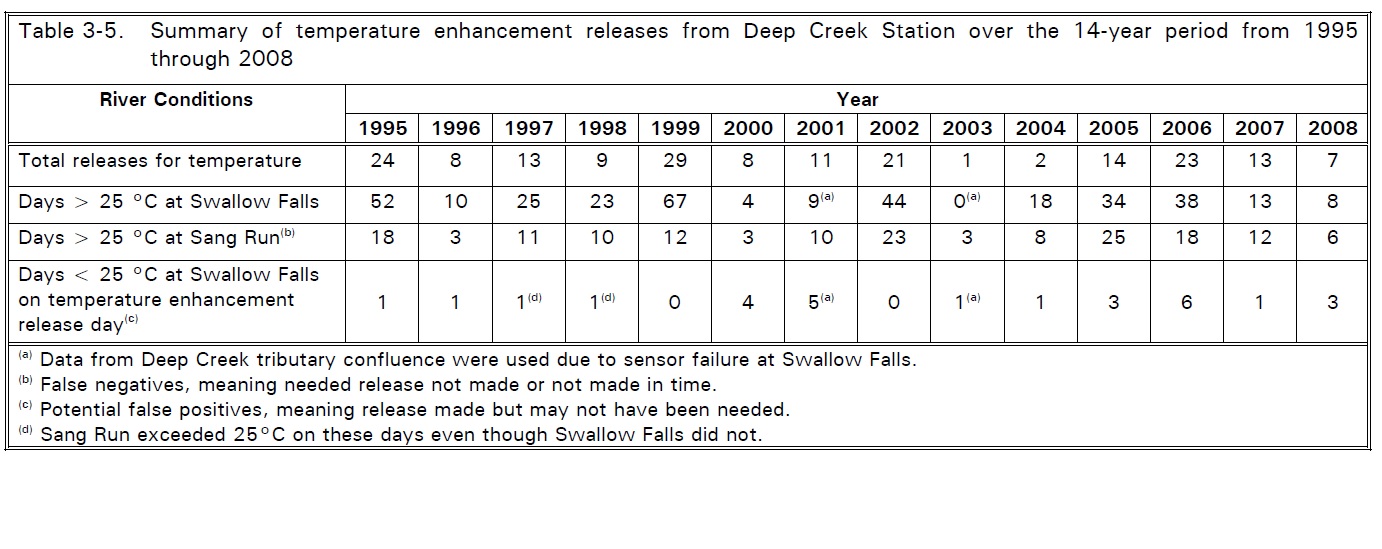
Implementation of the temperature enhancement protocol between 1995
and 2008 was very successful at maintaining lower temperatures than would
otherwise have occurred in the river without the releases. In summary,
the total number of days on which temperature exceeded 25°C at Sang
Run ranged from 3 in 1996, 2000, and 2003, to 25 in 2005. Temperatures
in excess of 25°C at Sang Run without operation of the DCHS (as represented
by data from the Swallow Falls or Deep Creek stations) would have occurred
on a minimum of 0 days in 2003 to a maximum of 67 days in 1999. Maximum
river temperature at Sang Run exceeded 27°C 16 times from 1995 through
2008; maximum temperature exceeded 25°C 162 times, and 64 of those
days exceeded 26°C; 61% of the exceedances were less than 26°C.
Data from Swallow Falls suggest that there were very few days when releasing
water for temperature enhancement was unnecessary (see table below; click
to enlarge).
Back to Top
River Recreation Survey
 The Power Plant Research Program's survey of private whitewater boating
counted a total of 2,356 boaters from June 7 to October 14, 1996 and 4,249 boaters from
April 18 to October 13, 1997. The total number of private boaters projected for the entire
boating season (April 15 through October 15) was 3,510 for 1996 and 4,398 for 1997, when
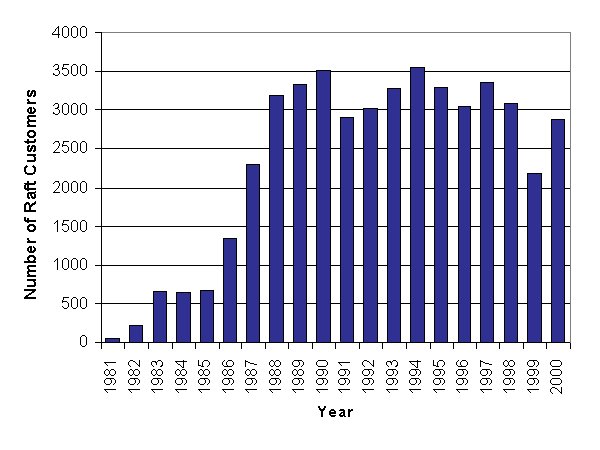
adjusted for days not surveyed. In comparison, there were 3,050 and 3,356 commercial raft
customers reported for 1996 and 1997, respectively. Seventy-seven percent of boaters used
the scheduled whitewater releases in 1996 while over 97% used these releases in 1997, a
year in which fewer days were available with boatable natural flows or other scheduled and
announced releases. Only a small percentage used natural flows, temperature enhancement
releases, or other unscheduled releases. Most boaters surveyed reside in Maryland, Ohio,
Pennsylvania, or West Virginia. A total of 41 states including the District of Columbia
and 11 foreign countries were represented.
The Power Plant Research Program's survey of private whitewater boating
counted a total of 2,356 boaters from June 7 to October 14, 1996 and 4,249 boaters from
April 18 to October 13, 1997. The total number of private boaters projected for the entire
boating season (April 15 through October 15) was 3,510 for 1996 and 4,398 for 1997, when
adjusted for days not surveyed. In comparison, there were 3,050 and 3,356 commercial raft
customers reported for 1996 and 1997, respectively. Seventy-seven percent of boaters used
the scheduled whitewater releases in 1996 while over 97% used these releases in 1997, a
year in which fewer days were available with boatable natural flows or other scheduled and
announced releases. Only a small percentage used natural flows, temperature enhancement
releases, or other unscheduled releases. Most boaters surveyed reside in Maryland, Ohio,
Pennsylvania, or West Virginia. A total of 41 states including the District of Columbia
and 11 foreign countries were represented.
Because most scheduled whitewater releases occurred on Mondays and Fridays
during this study period, most use occurred on those days, regardless
of whether or not these days were on holiday weekends. Use was very high
on holiday weekends, with the highest average occurring on holiday Saturdays
in 1997 (131 boaters per day). The maximum number of private boaters on
a single day during the period surveyed occurred on July 19, 1997 (170
boaters in 154 boats of all types). Based on the numbers of commercial
rafters reported for the last 7 years, usage of the Upper Youghiogheny
River by commercial boaters appears to be relatively stable and not increasing
in total numbers. No conclusive statements can be made regarding total
annual usage patterns of the river by private boaters, based on results
of this survey and two previous surveys. However, peak daily usage was
greater in 1997 than in earlier years sampled (1988, 1995 and 1996).
The complete recreation survey report is available. (Survey of
Noncommercial Recreational Use of Whitewater in the Upper Youghiogheny
River, 1996-1997)
Back to Top
