River Input
 The Chesapeake Bay Program non-tidal network was initiated in 2004 and consists of 126 stations located throughout the Chesapeake Bay’s 64,000 square mile watershed. The state of Maryland has 24 non-tidal network stations that are sampled by the Department of Natural Resources (DNR) and four River Input Monitoring (RIM) Program stations that are sampled by the U.S. Geological Survey (USGS). The focus of the non-tidal network is on relatively small tributaries.
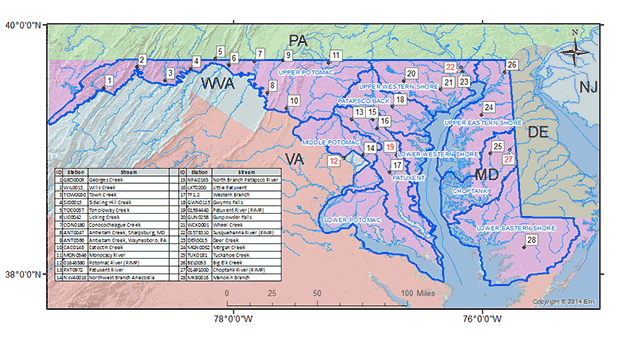
The main objectives of the non-tidal network monitoring program are to improve measurement of nutrients and sediment concentrations for the calculation of loads discharged to the Chesapeake Bay watershed, improve the accuracy of the watershed model, and help identify factors affecting nutrient and sediment loads. The focus of the River Input Monitoring Program, which was initiated in the mid-1980s is loads and trends for major tributaries like the Susquehanna, Potomac, Patuxent, and Choptank Rivers in Maryland. All stations are sampled using USGS-approved methods to be consistent across both monitoring programs and among participating agencies. The sampling procedures developed by USGS ensure that water quality samples are representative of stream conditions. All stations are located near a USGS stream gage. The station names and locations are presented in the figure below.

Water quality sampling conducted as part of the non-tidal network consists of collecting monthly “routine” samples i.e., non-targeted samples on pre-determined dates, and eight samples that target storms so that a range of flows can be used to calculate trends and loads. Storm samples are collected two per quarter to account for the effects of seasonal changes.
Each agency that participates in the non-tidal network monitoring program is required to prepare a Quality Assurance Project Plan (QAPP) that describes in detail the sample collection procedures and laboratory methods that are used to analyze the samples. The Quality Assurance Project Plans for each participating agency can be found at: http://eyesonthebay.dnr.maryland.gov/eyesonthebay/stories.cfm
USGS maintains a web site (http://cbrim.er.usgs.gov/) that provides a description of the non-tidal network and RIM Program data sets used in their analyses and how they are constructed. In addition, the web site describes the statistical model that is used to calculate loads and trends. Load and trend results are not available for all stations, because stations were added to the network at various times and loads and trends cannot be accurately determined unless the minimum required years of data are available. If there are between 80 and 90 observations, USGS uses the WRTDS (Weighted Regressions on Time, Discharge, and Season) model for loads if there is sufficient wet year/dry year variability in the data. To calculate trends, a minimum of nine or ten years of data are needed.
The USGS web site has summaries of trend results that consist of interactive and downloadable maps. Loads are also available on the web site for both annual and monthly time periods.