Regional
Spawning Comparisons Sex Ratio
Spawning Surveys Striped Bass
Tagging Study Invasive Species
Monitoring
Striped Bass Spring Spawning Stock Assessment

The Striped Bass Program is responsible for monitoring and characterizing Maryland's portion of the Chesapeake Bay's spawning stock of striped bass. Since 1985, biologists at the Maryland Department of Natural Resources have been conducting the spawning stock survey in historic spawning locations on the Upper Chesapeake Bay and the Potomac River. In concurrence with monitoring the spawning stock, the department is part of the
Cooperative Coastal Striped Bass Tagging Program. This program tags spawning striped bass with United States Fish and Wildlife Service internal anchor tags to evaluate stock dynamics of the migratory Atlantic Coast striped bass. All the results from these surveys are reported to the United States Fish and Wildlife Service in the annual Federal Aid Report and to the Atlantic States Marine Fisheries Commission (ASMFC) in the annual Compliance Report.
Spawning Stock Survey
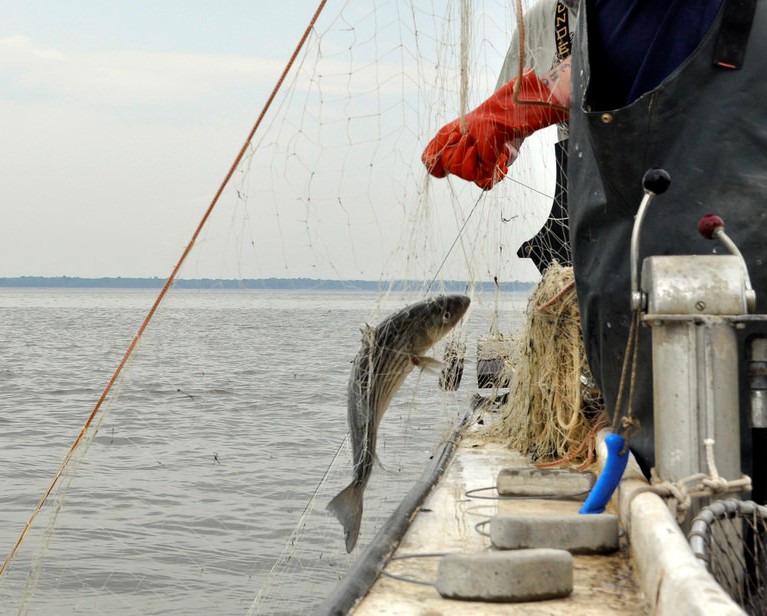
The goal of this survey is to characterize the age, size, and sex structure, as well as the abundance at age of spawning striped bass in Maryland's portion of the Chesapeake Bay. The survey is conducted up to six days a week from late March to mid May. Striped bass are sampled using experimental drift gill nets in the Upper Chesapeake Bay and Potomac River.
Traditionally, the experimental drift gill nets have consisted of a series of nylon multifilament panels of varying mesh sizes (3, 3.75, 4.5, 5.25, 6, 6.5, 7, 8, 9, and 10 inch stretch-mesh). Each panel is approximately 150 feet long and 10 feet deep, with 10-foot gaps between each net. Because nylon gill nets have become increasingly difficult and expensive to purchase, the department is exploring a transition to monofilament nets through an ongoing gear comparison study. Following a 2024 pilot in the Upper Bay, the study expanded in 2025 by incorporating several new monofilament components into the regular sampling routine. This expansion allows for a direct performance comparison between traditional equipment and the proposed alternatives under standard field conditions.
These drift nets are deployed for short periods of time during and near slack tide, twice a day at one random site each, in the Upper Chesapeake Bay and Potomac River. Biologists collect length, fish health, sex, maturity stage and scale samples to determine age. Scale samples are used to make an age-length key for the spawning stock. This key is used to determine the size at age and sex ratio at age of the striped bass spawning stock of Maryland's portion of the Chesapeake Bay. These data are inputs to the coastwide stock assessment conducted by the Atlantic States Marine Fisheries Commission.
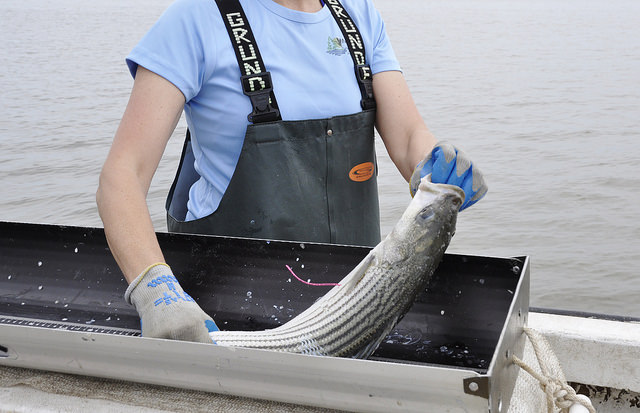 Along with biological data, healthy striped bass are tagged with internal anchor tags provided by the United States Fish and Wildlife Service (USFWS). A preliminary total of 1,980 (1,276 in the Upper Chesapeake Bay and 704 on the Potomac River) striped bass were sampled during the 2025 spring spawning stock survey. Of the 1,276 striped bass in the Upper Chesapeake Bay, there were 97 females and 1,179 males. In the Potomac River, there were 50 females and 654 males sampled. These numbers are the preliminary total fish caught and are not standardized for catch per unit of effort until later reports.
Top↑
Regional Spawning Comparisons
To effectively showcase the differences across systems, the department evaluates the abundance of male and female fish across both primary spawning areas. Side by side comparisons of the Upper Chesapeake Bay and the Potomac River help illustrate regional shifts and differences in population structure over time.
Upper Bay Gill Net Survey
The graph below shows the results of the Upper Bay Gill Net Survey from 1985 until 2025.
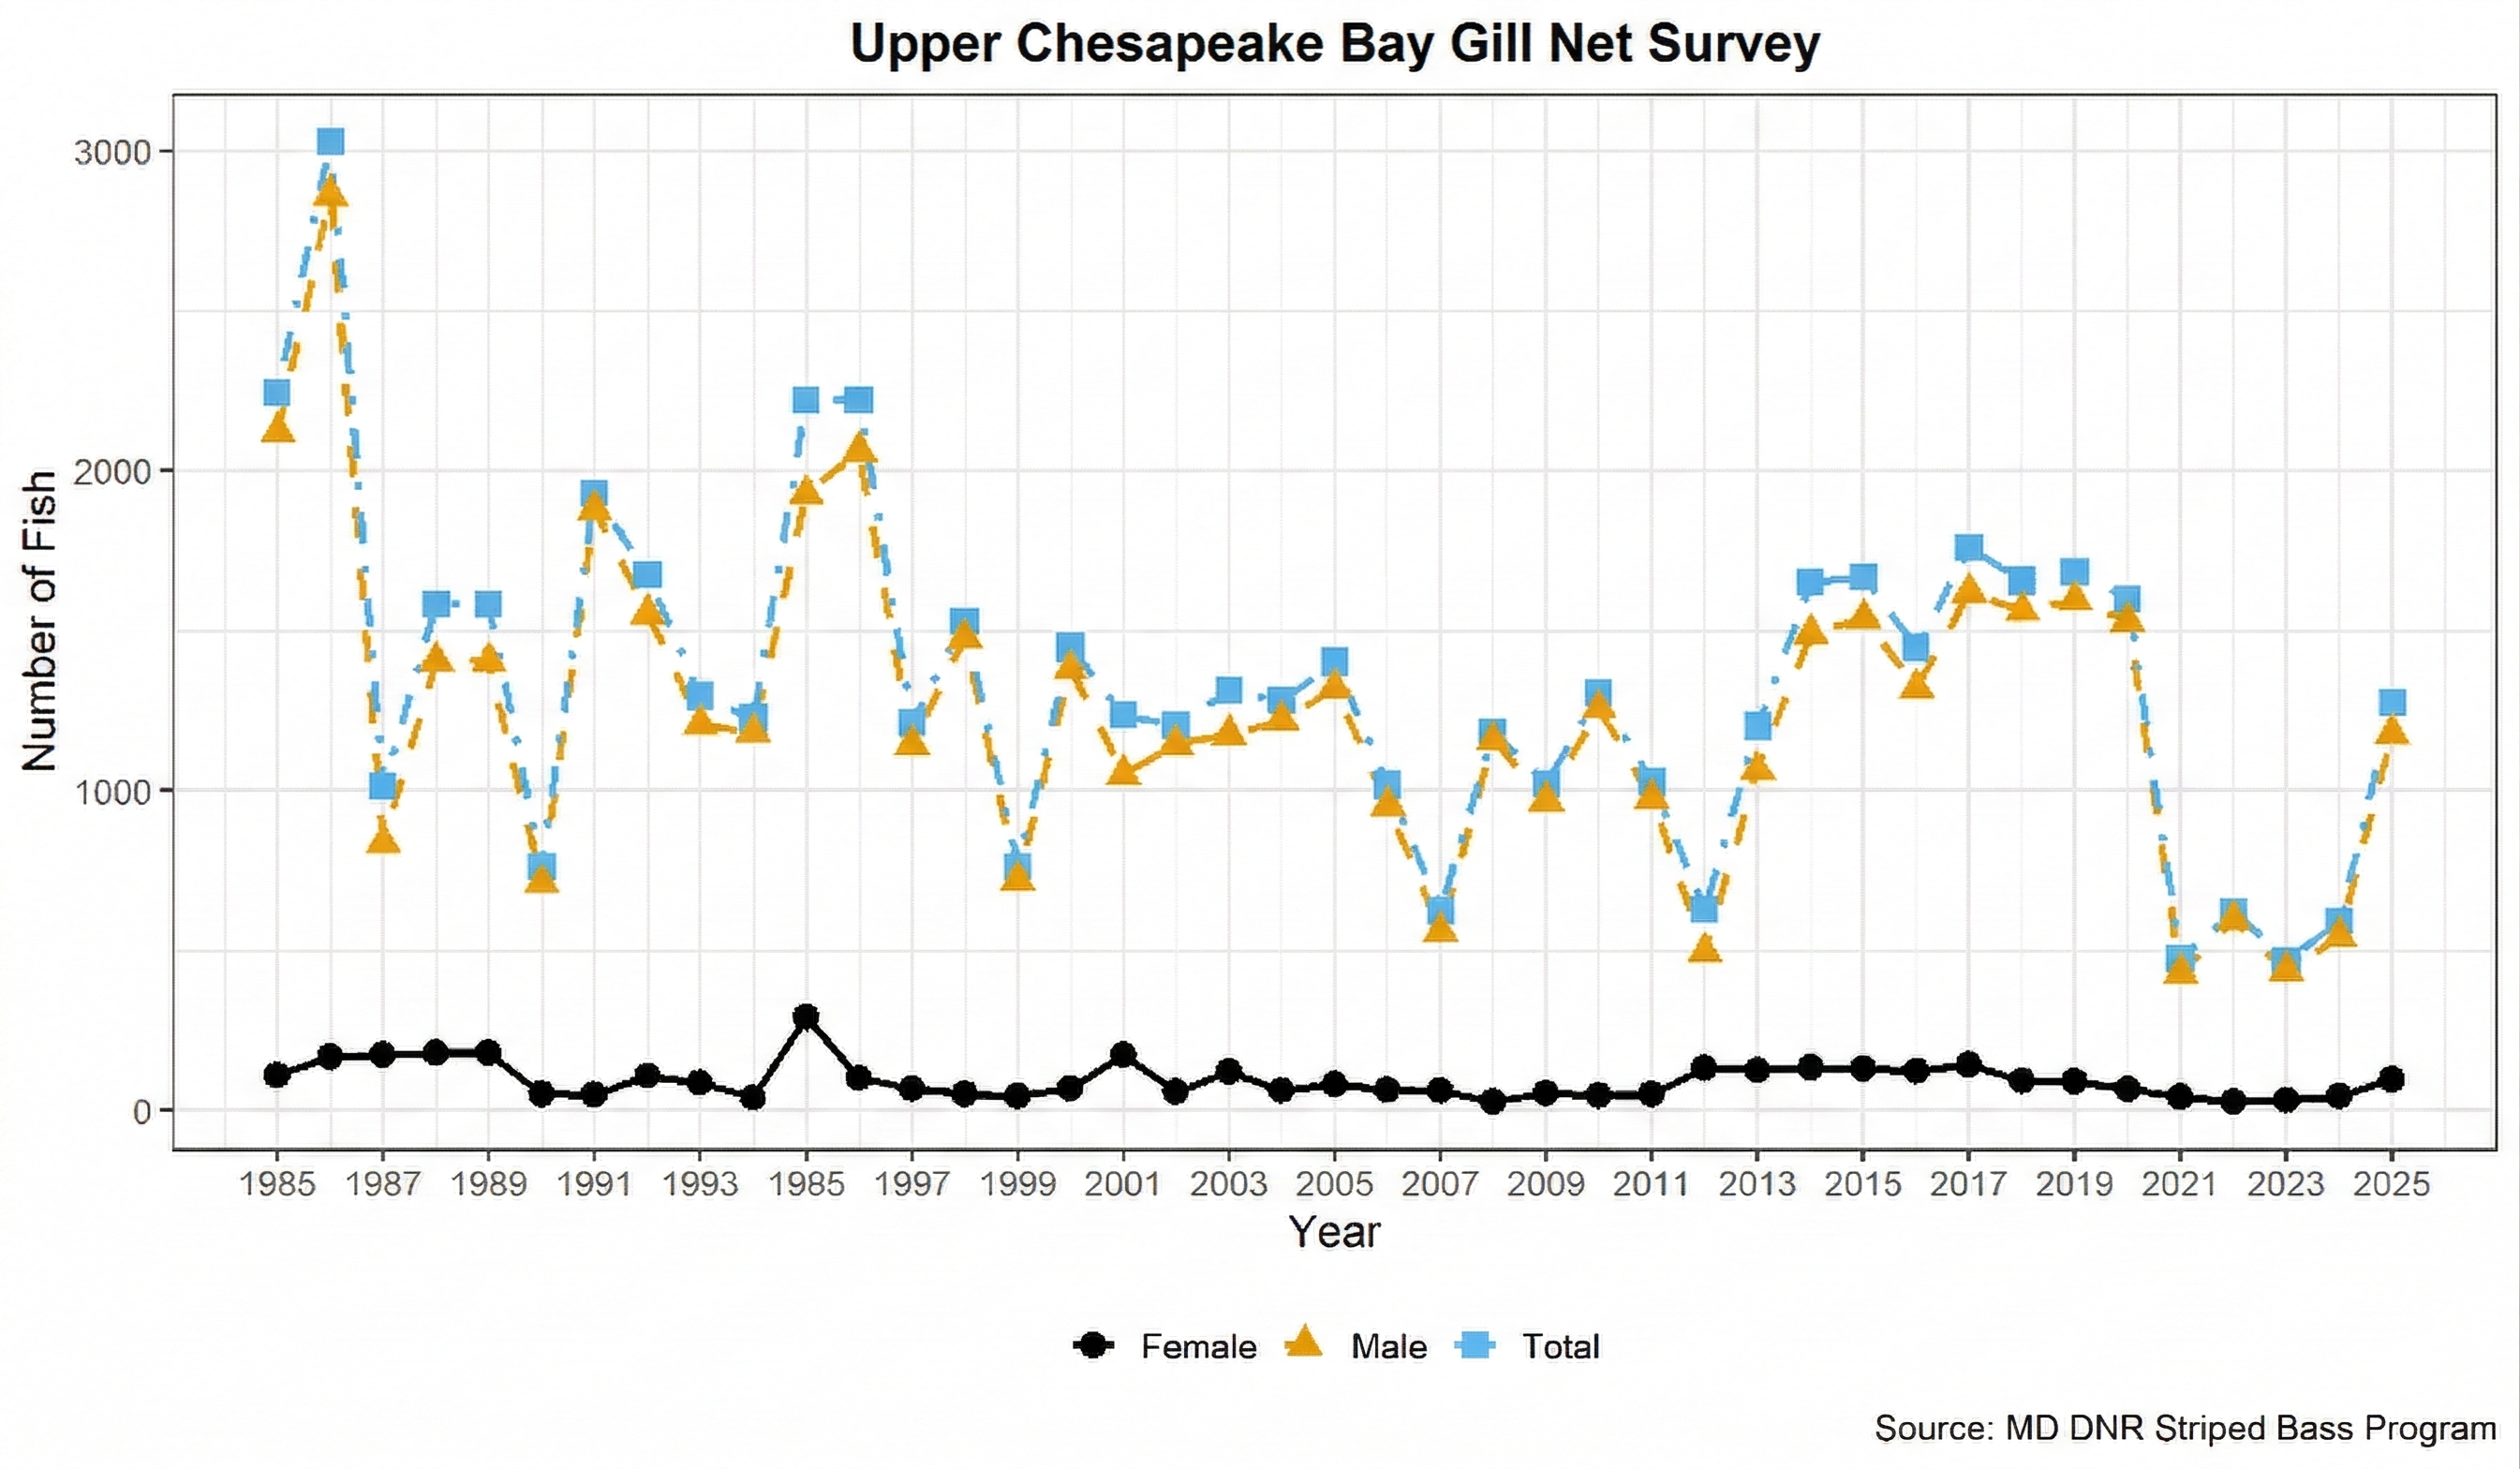
The line graph above shows gill net survey striped bass population trends in the Upper Chesapeake Bay by biological sex from 1985 to 2025. The data shows an initial peak in 1986, with total fish counts exceeding 3,000. The Department of Natural Resources notes that these early high counts were influenced by higher sampling effort during the initial years of the survey, making them less comparable to later years. Following this period, the population shows high variability, with cycles of peaks and declines typically ranging between 500 and 2,000 total fish. The population structure is heavily skewed toward male striped bass (orange triangles), which closely track the total population count (blue squares). Female striped bass (black circles) remain at a much lower, stable abundance throughout the 40 year series, generally staying below 250 fish. Recent data indicates a recovery from a 2021 low, with 2025 counts approaching 1,300 total fish.
View accessible data table for Upper Chesapeake Bay Gill Net Striped Bass Spawning Stock Survey (tab Upper Bay Gill Net Data).
Potomac River Gill Net Survey
The graph below shows the results of the Potomac River Gill Net Survey from 1985 until 2025.
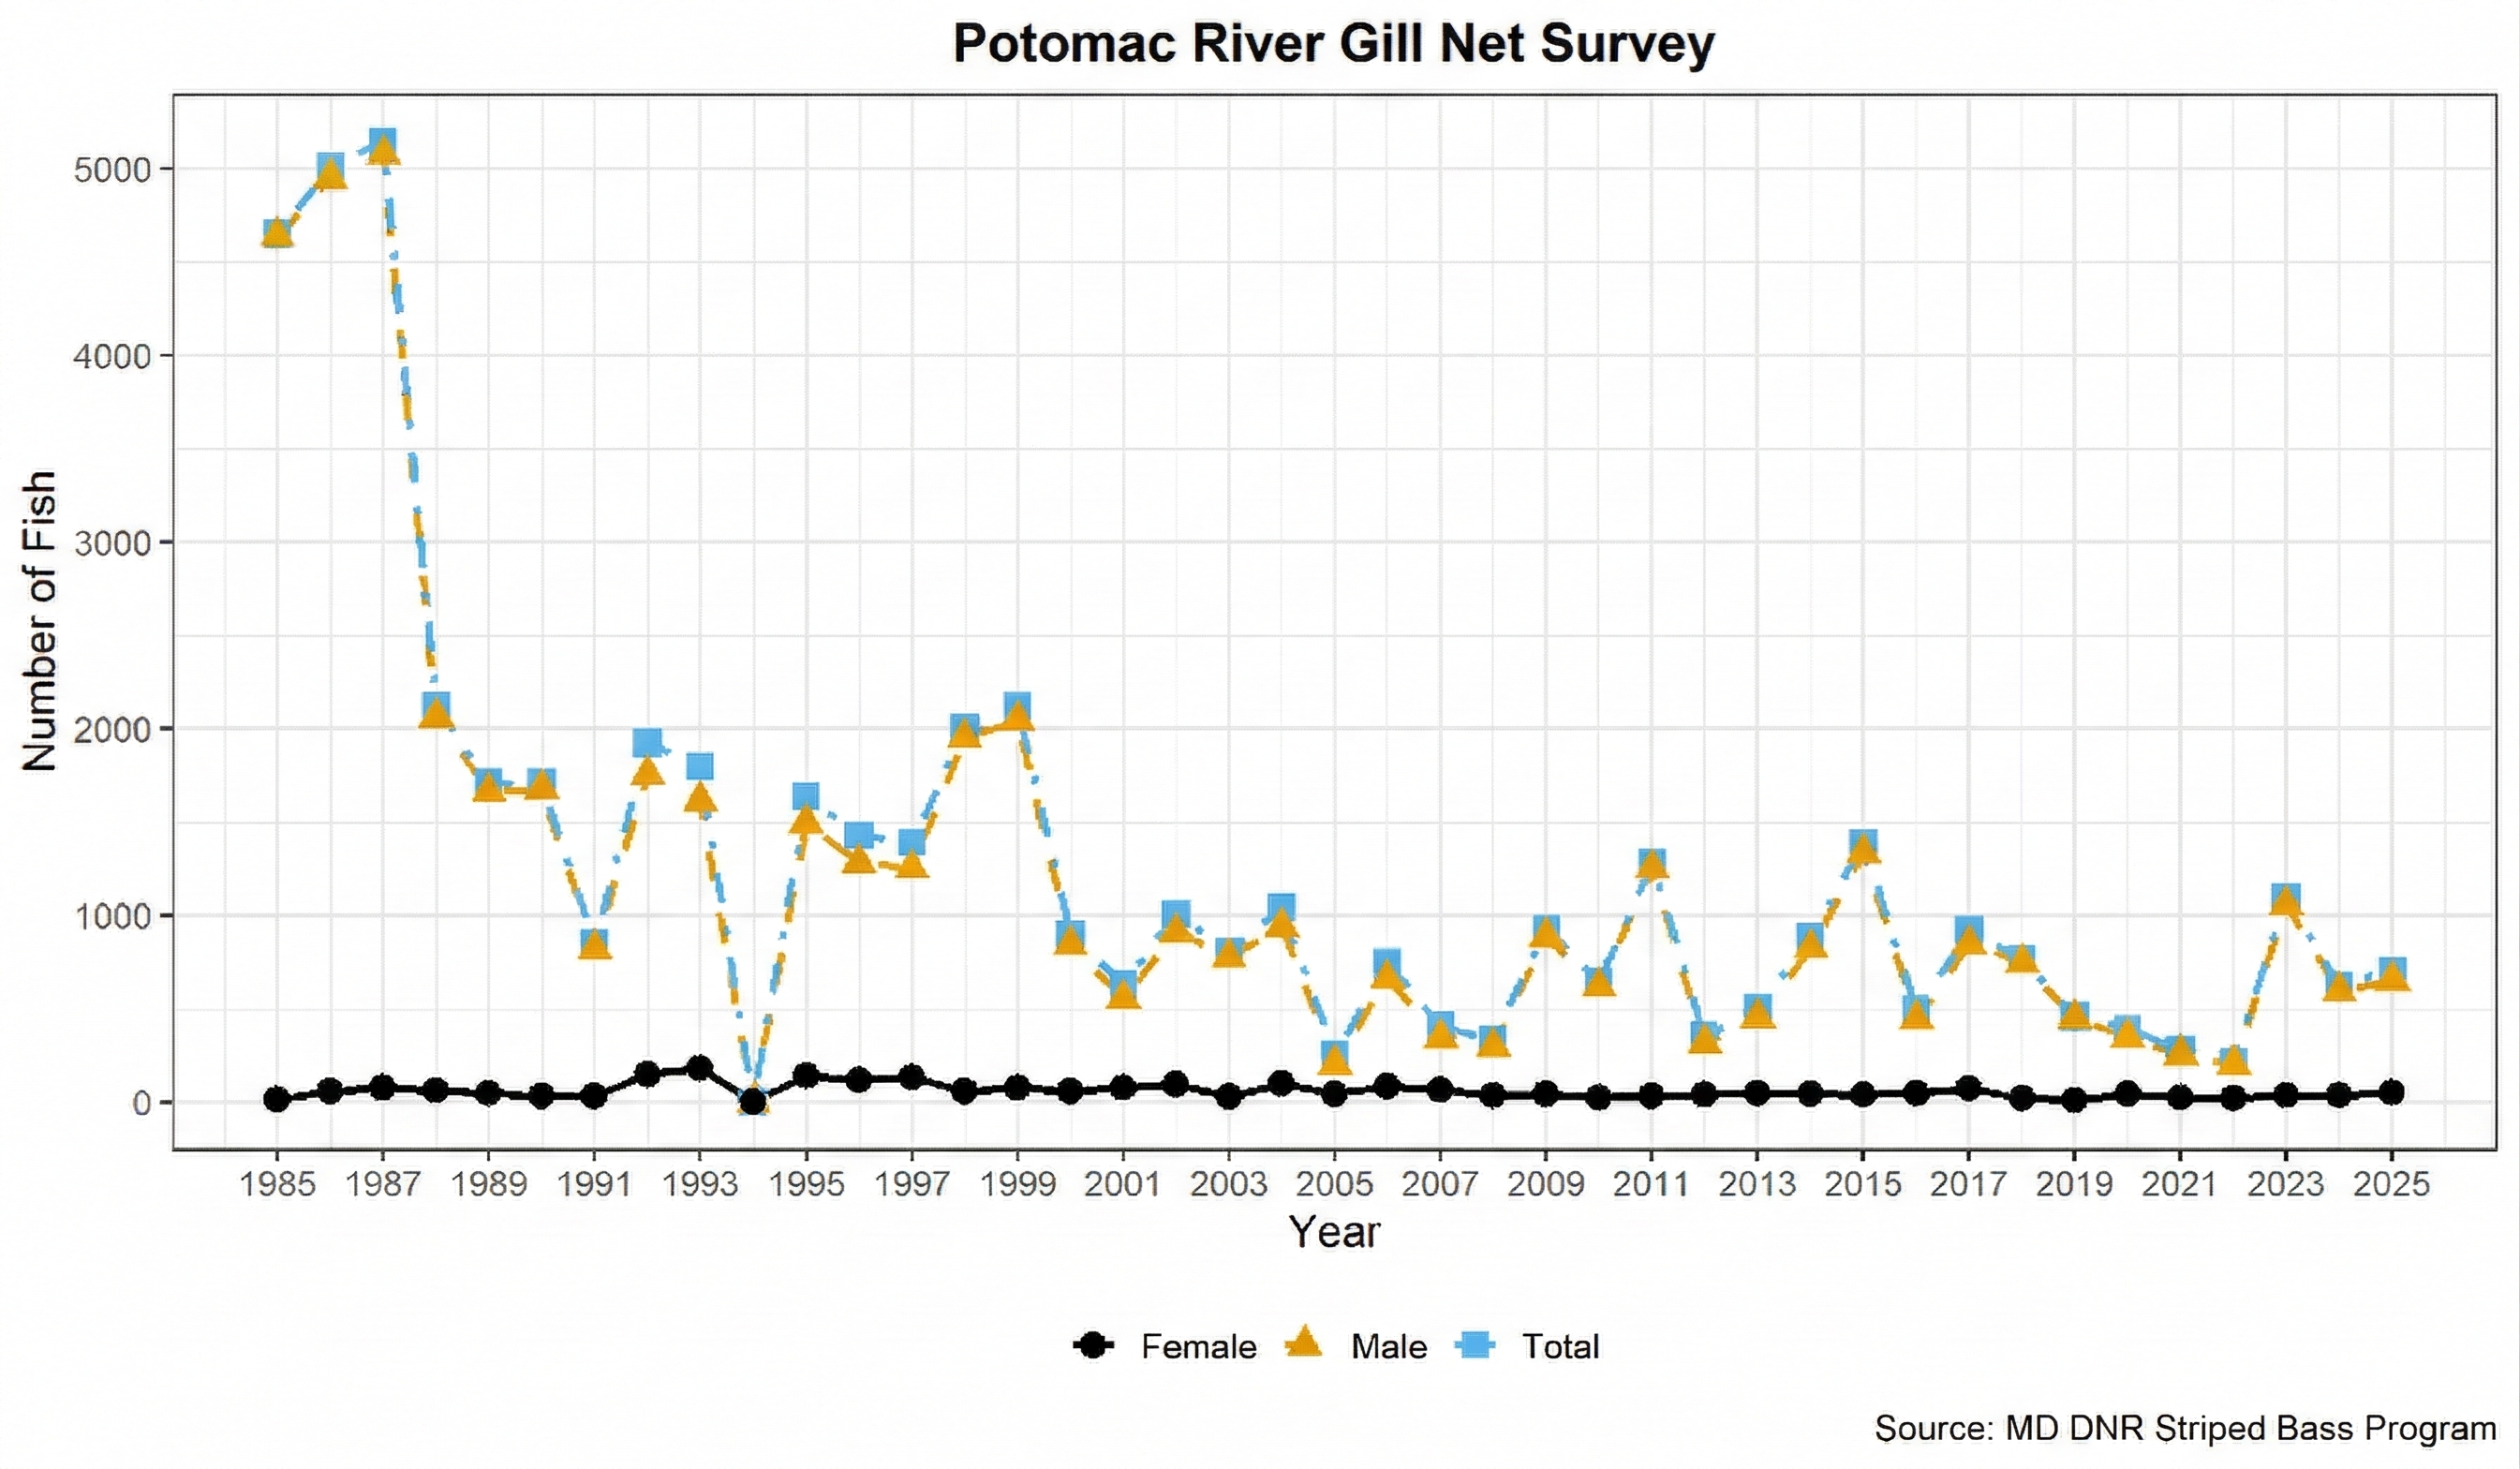
The above line graph shows striped bass gill net survey population trends in the Potomac River by biological sex from 1985 to 2025. The data shows a massive peak in 1986, with total fish counts exceeding 5,000; however, the Department of Natural Resources has identified that these early figures were influenced by higher sampling effort during the initial years of the survey.
Following this early period, the population settled into a lower, fluctuating trend, typically ranging between 500 and 2,000 total fish. The graph highlights a significant disparity in sex structure: the total population (blue squares) is almost entirely driven by male striped bass (gold triangles), while female striped bass (black circles) remained consistently low and stable throughout the 40 year period. A notable data gap is visible in 1994. Recent years show a continued low abundance trend, with 2025 counts remaining well below historical averages. Detailed annual values are available in the link following this image.
View accessible data table for the Potomac River Gill Net Striped Bass Spawning Stock Survey (tab Potomac Gill Net Data).
Top↑
Understanding Sex Ratios in Spawning Surveys
It is important to note that male striped bass are significantly more common than females in these surveys. This disparity is a natural characteristic of the spawning population. Male striped bass reach sexual maturity much earlier (around age 2) than females (around age 6). Additionally, while a female may only remain on the spawning grounds for a short window to deposit her eggs, multiple males will often surround a single female and may remain in the spawning area for the duration of the season. Consequently, males are much more likely to be encountered by survey nets.
Male Striped Bass Comparison
This comparison highlights the high variability in male abundance between the two systems. In recent decades, the Upper Chesapeake Bay has generally maintained a higher relative count of male fish compared to the Potomac, with the two systems often mirroring each other's cyclical peaks and declines.
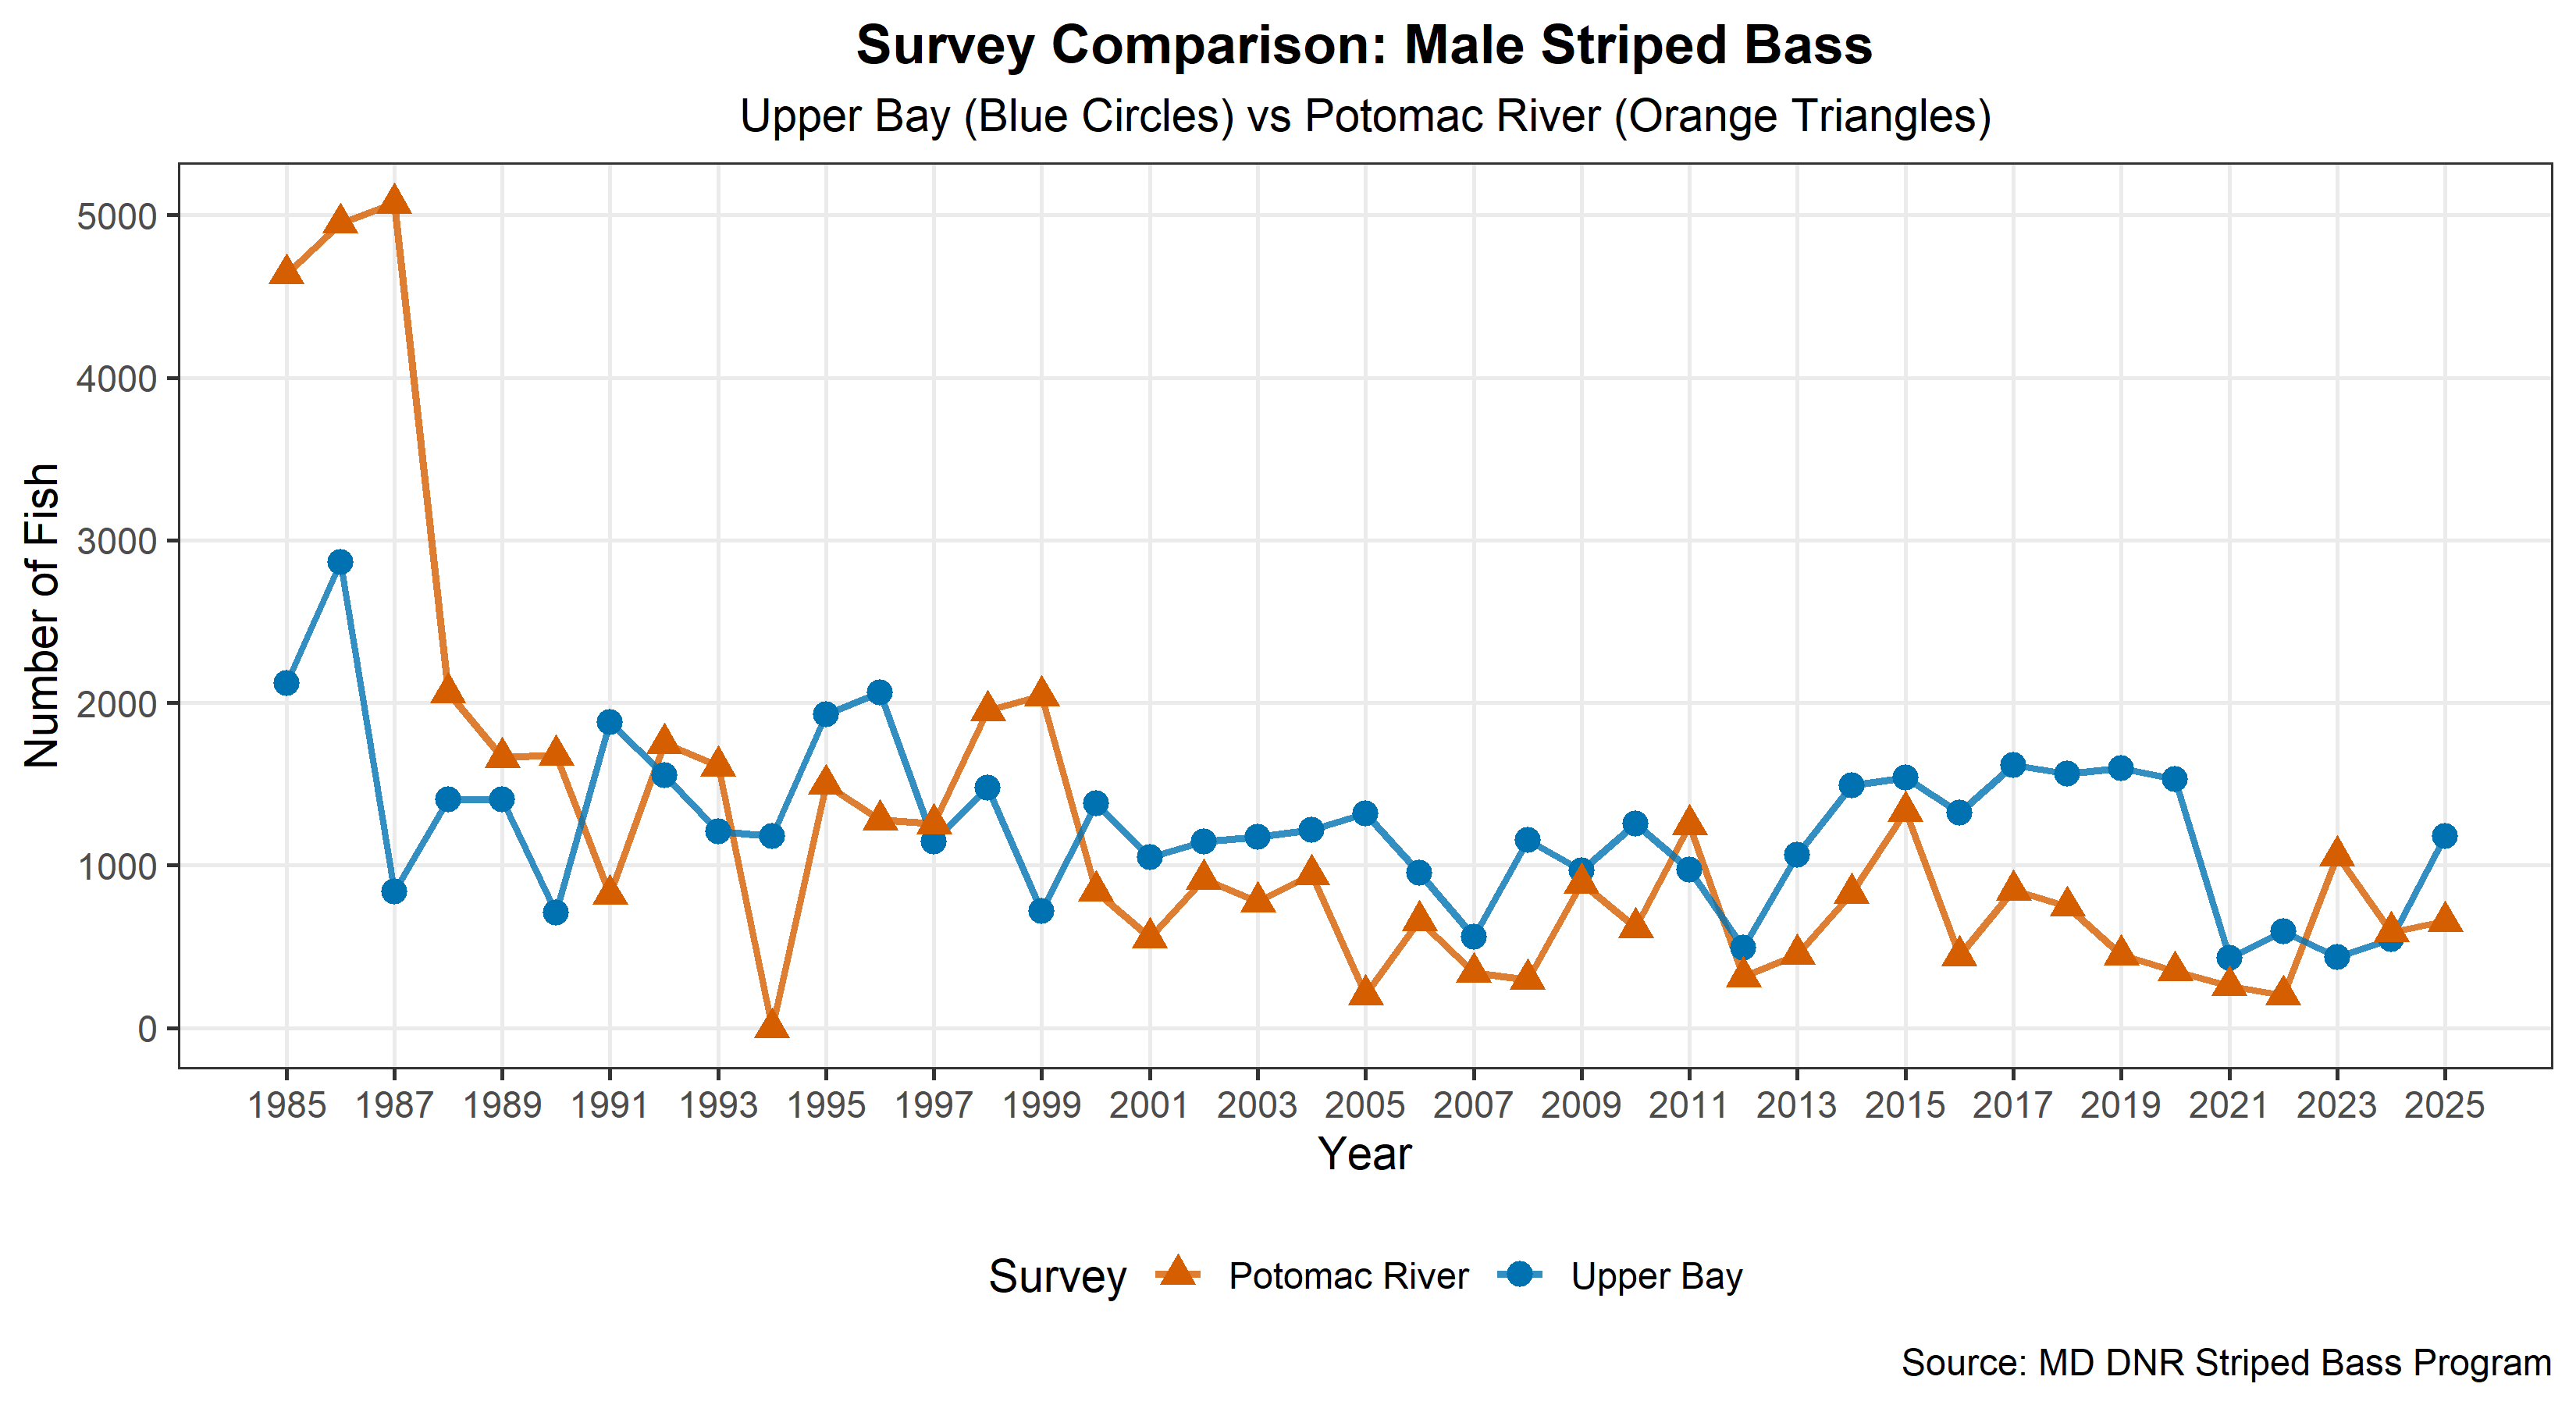
The graph above is displaying the abundance of male striped bass in the Upper Chesapeake Bay (blue circles) and the Potomac River (orange triangles) from 1985 to 2025. The data shows high historical variability between the two systems, characterized by a massive peak in the Potomac River during the mid 1980s where counts exceeded 5,000 fish. Following this early period, both systems settled into a fluctuating trend generally ranging between 500 and 2,000 fish. In recent decades, the Upper Chesapeake Bay has frequently maintained a higher relative count of male fish compared to the Potomac River, though both systems show mirrored cyclical peaks and declines. Detailed annual values are available in the link following this image.
View accessible data table for the Male Striped Bass Spawning Comparison (tab Male Spawning Data).
Female Striped Bass Comparison
Monitoring the female spawning stock is critical for assessing the long term reproductive potential of the species. The survey data indicates that the Upper Bay consistently supports a higher abundance of female striped bass than the Potomac River. While both areas have experienced significant fluctuations over the 40 year survey period, the Upper Bay has frequently seen peaks such as in 1995 and 2001 that were not as pronounced in the Potomac. In both regions, female counts remain at a much lower, more stable abundance compared to their male counterparts.
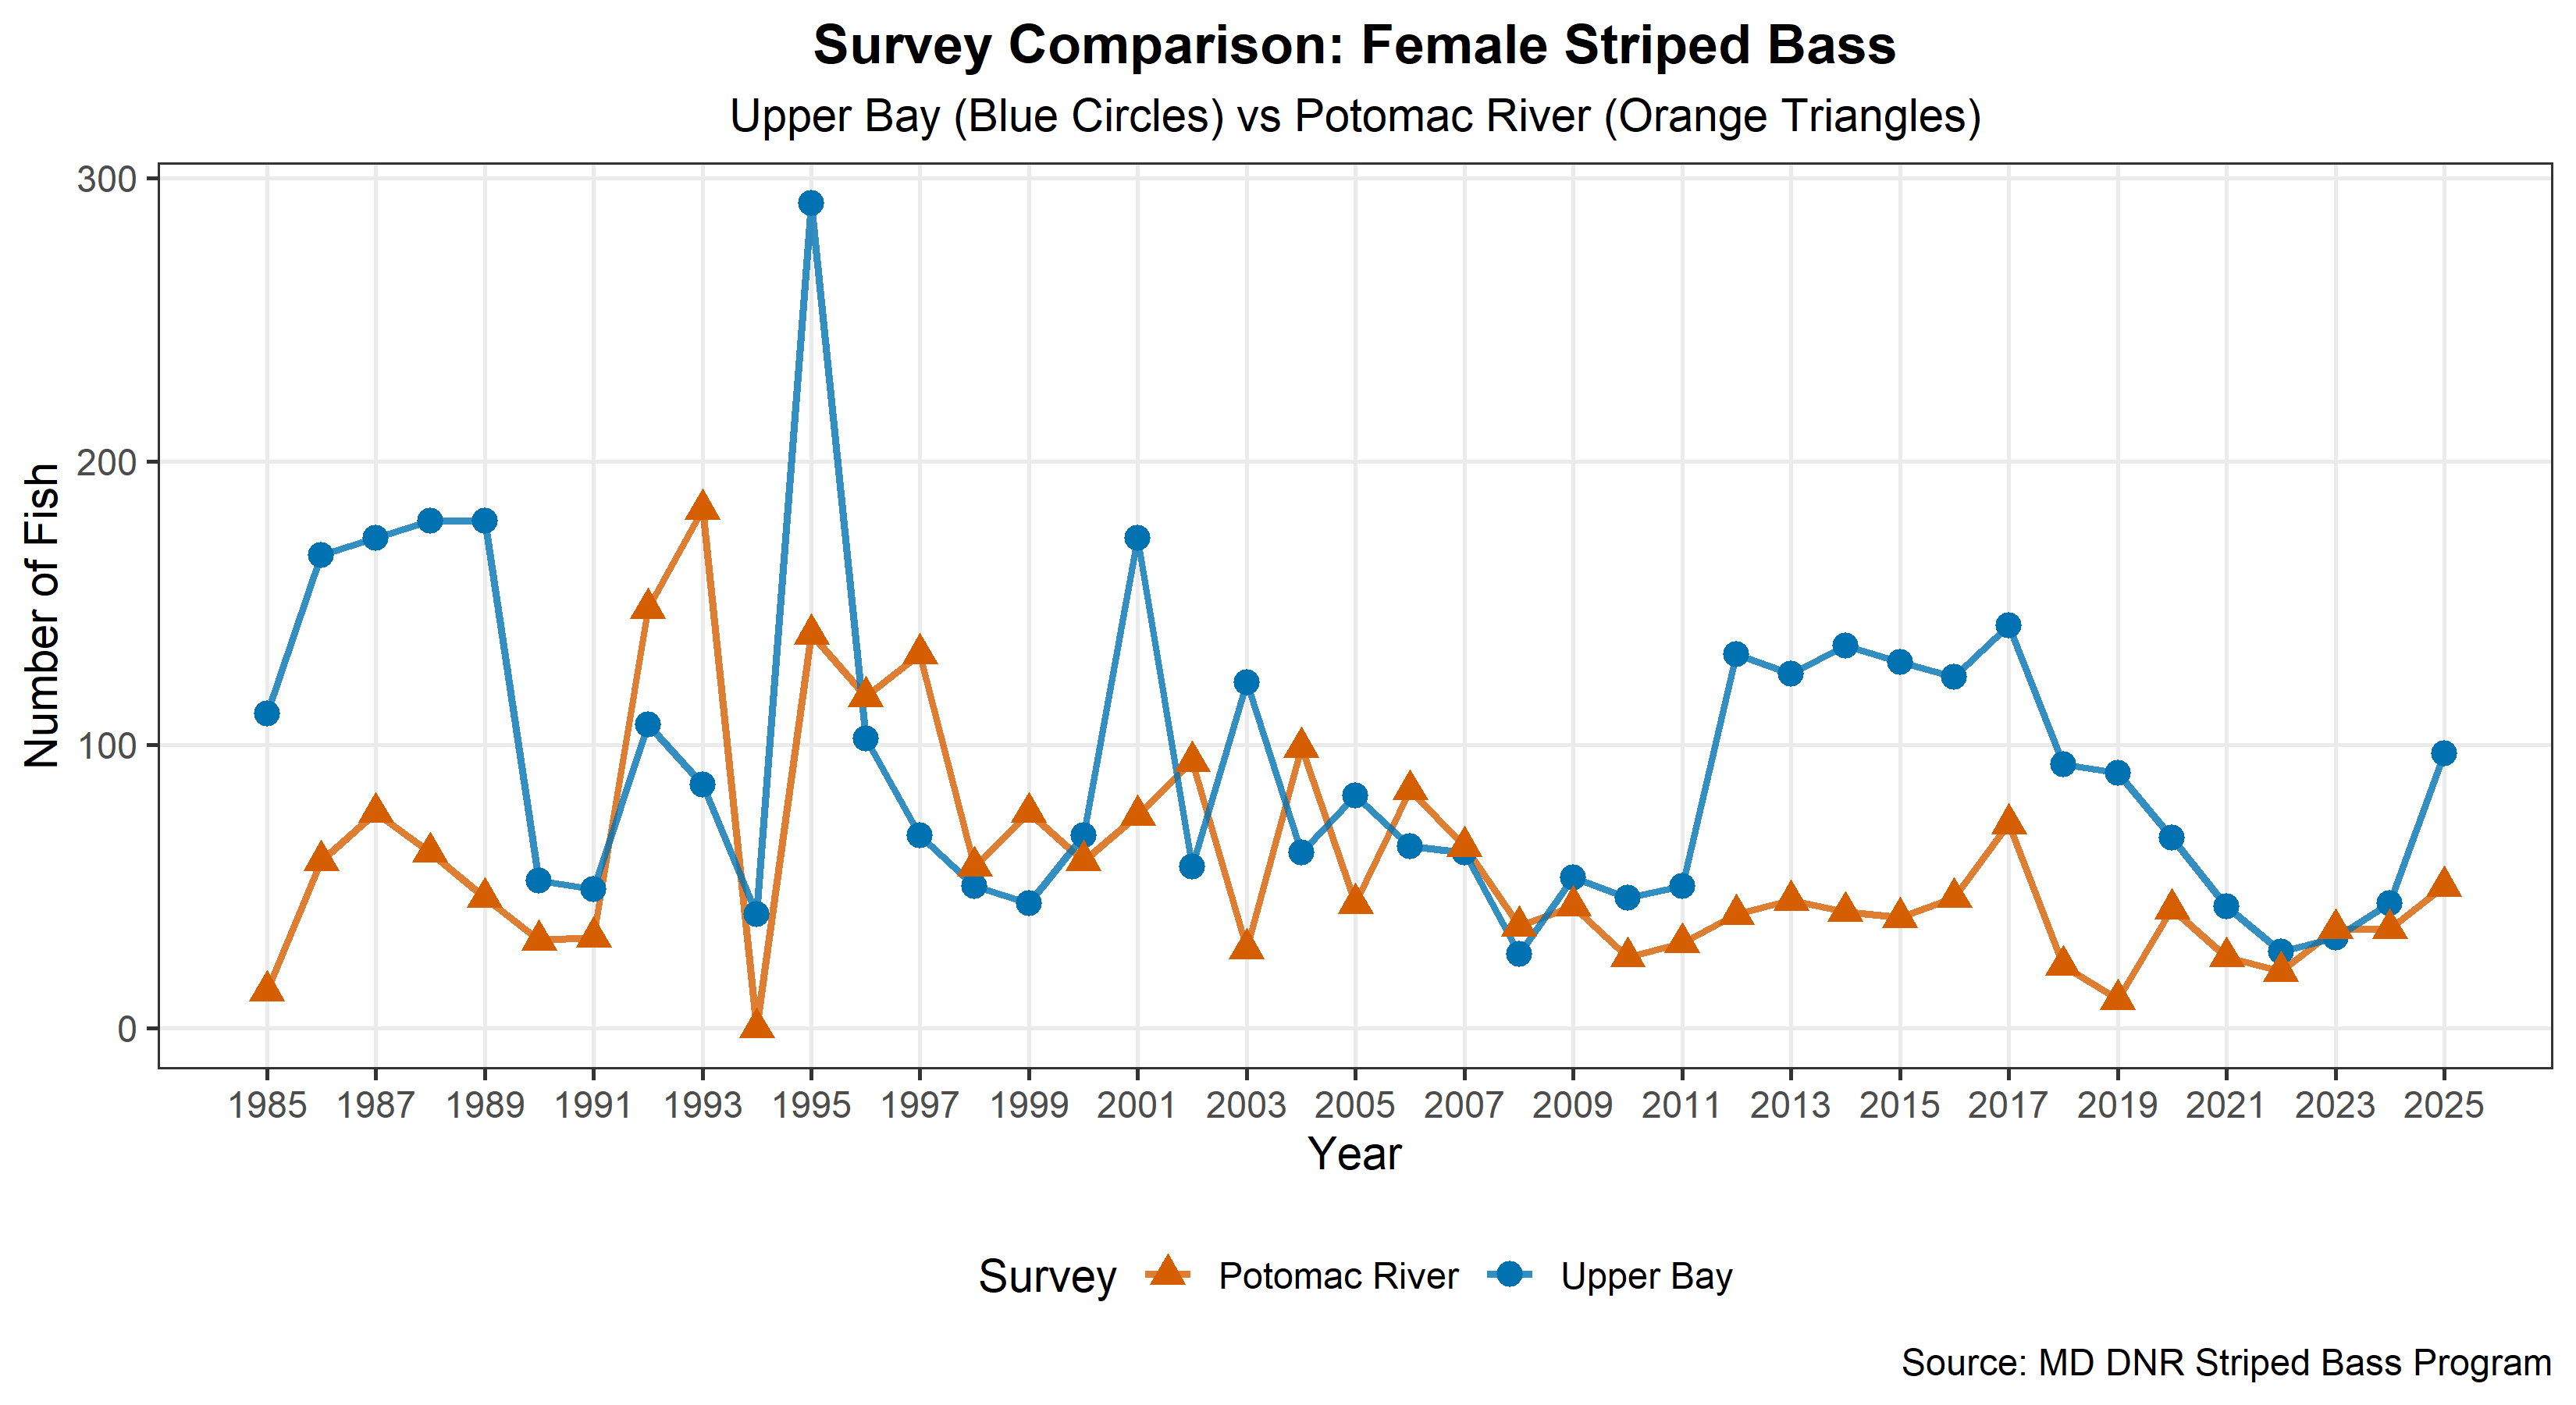
The graph above is displaying the abundance of female striped bass in the Upper Chesapeake Bay (blue circles) and the Potomac River (orange triangles) from 1985 to 2025. The graph shows that female counts remain at a significantly lower and more stable abundance than males across the 40 year series, with totals generally staying below 300 fish. The Upper Chesapeake Bay consistently supports a higher abundance of female striped bass than the Potomac River, with notable peaks in 1995 and 2001 that were not as pronounced in the Potomac system. Recent data shows both systems remaining at the lower end of their historical ranges, with the Upper Bay continuing to show slightly higher numbers than the Potomac. Detailed annual values are available in the link following this image.
View accessible data table for the Female Striped Bass Spawning Comparison (tab Female Spawning Data).
Striped Bass Tagging Study
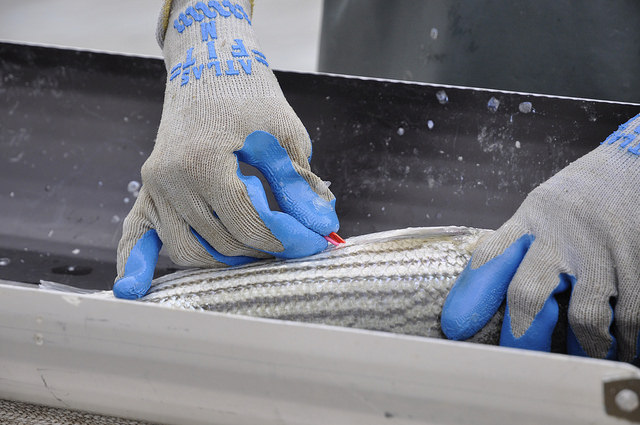
The purpose of this survey is to evaluate Chesapeake Bay resident and Atlantic migratory striped bass stock dynamics. This study is conducted by Maryland Department of Natural Resources biologists during the spring spawning stock survey as part of the Cooperative Coastal Striped Bass Tagging Program, and the results are part of the coastwide stock assessment conducted by the Atlantic States Marine Fisheries Commission. Biologists apply pink internal anchor tags through an incision made in the left side of healthy fish, slightly behind and below the tip of the pectoral fin. Tagging striped bass allows biologists to collect data on individual striped bass over time (growth rates, mortality rates, survival rates, and migration rates/patterns). In 2025, MD DNR biologists tagged a total of 861 striped bass (494 in the Upper Chesapeake Bay and 367 on the Potomac River). To date, over 41,000 striped bass have been tagged on the spawning grounds in Maryland, and over 9,000 recaptures have been reported. The success of the tagging program relies on anglers reporting their tags. To report a tagged fish please go to the department's Tag Return Program or call the United States Fish and Wildlife Service at 1-800-448-8322.
Tags Deployed
The graph below shows the amount of the striped bass tags in the Upper Bay and Potomac River from 1987 until 2025.
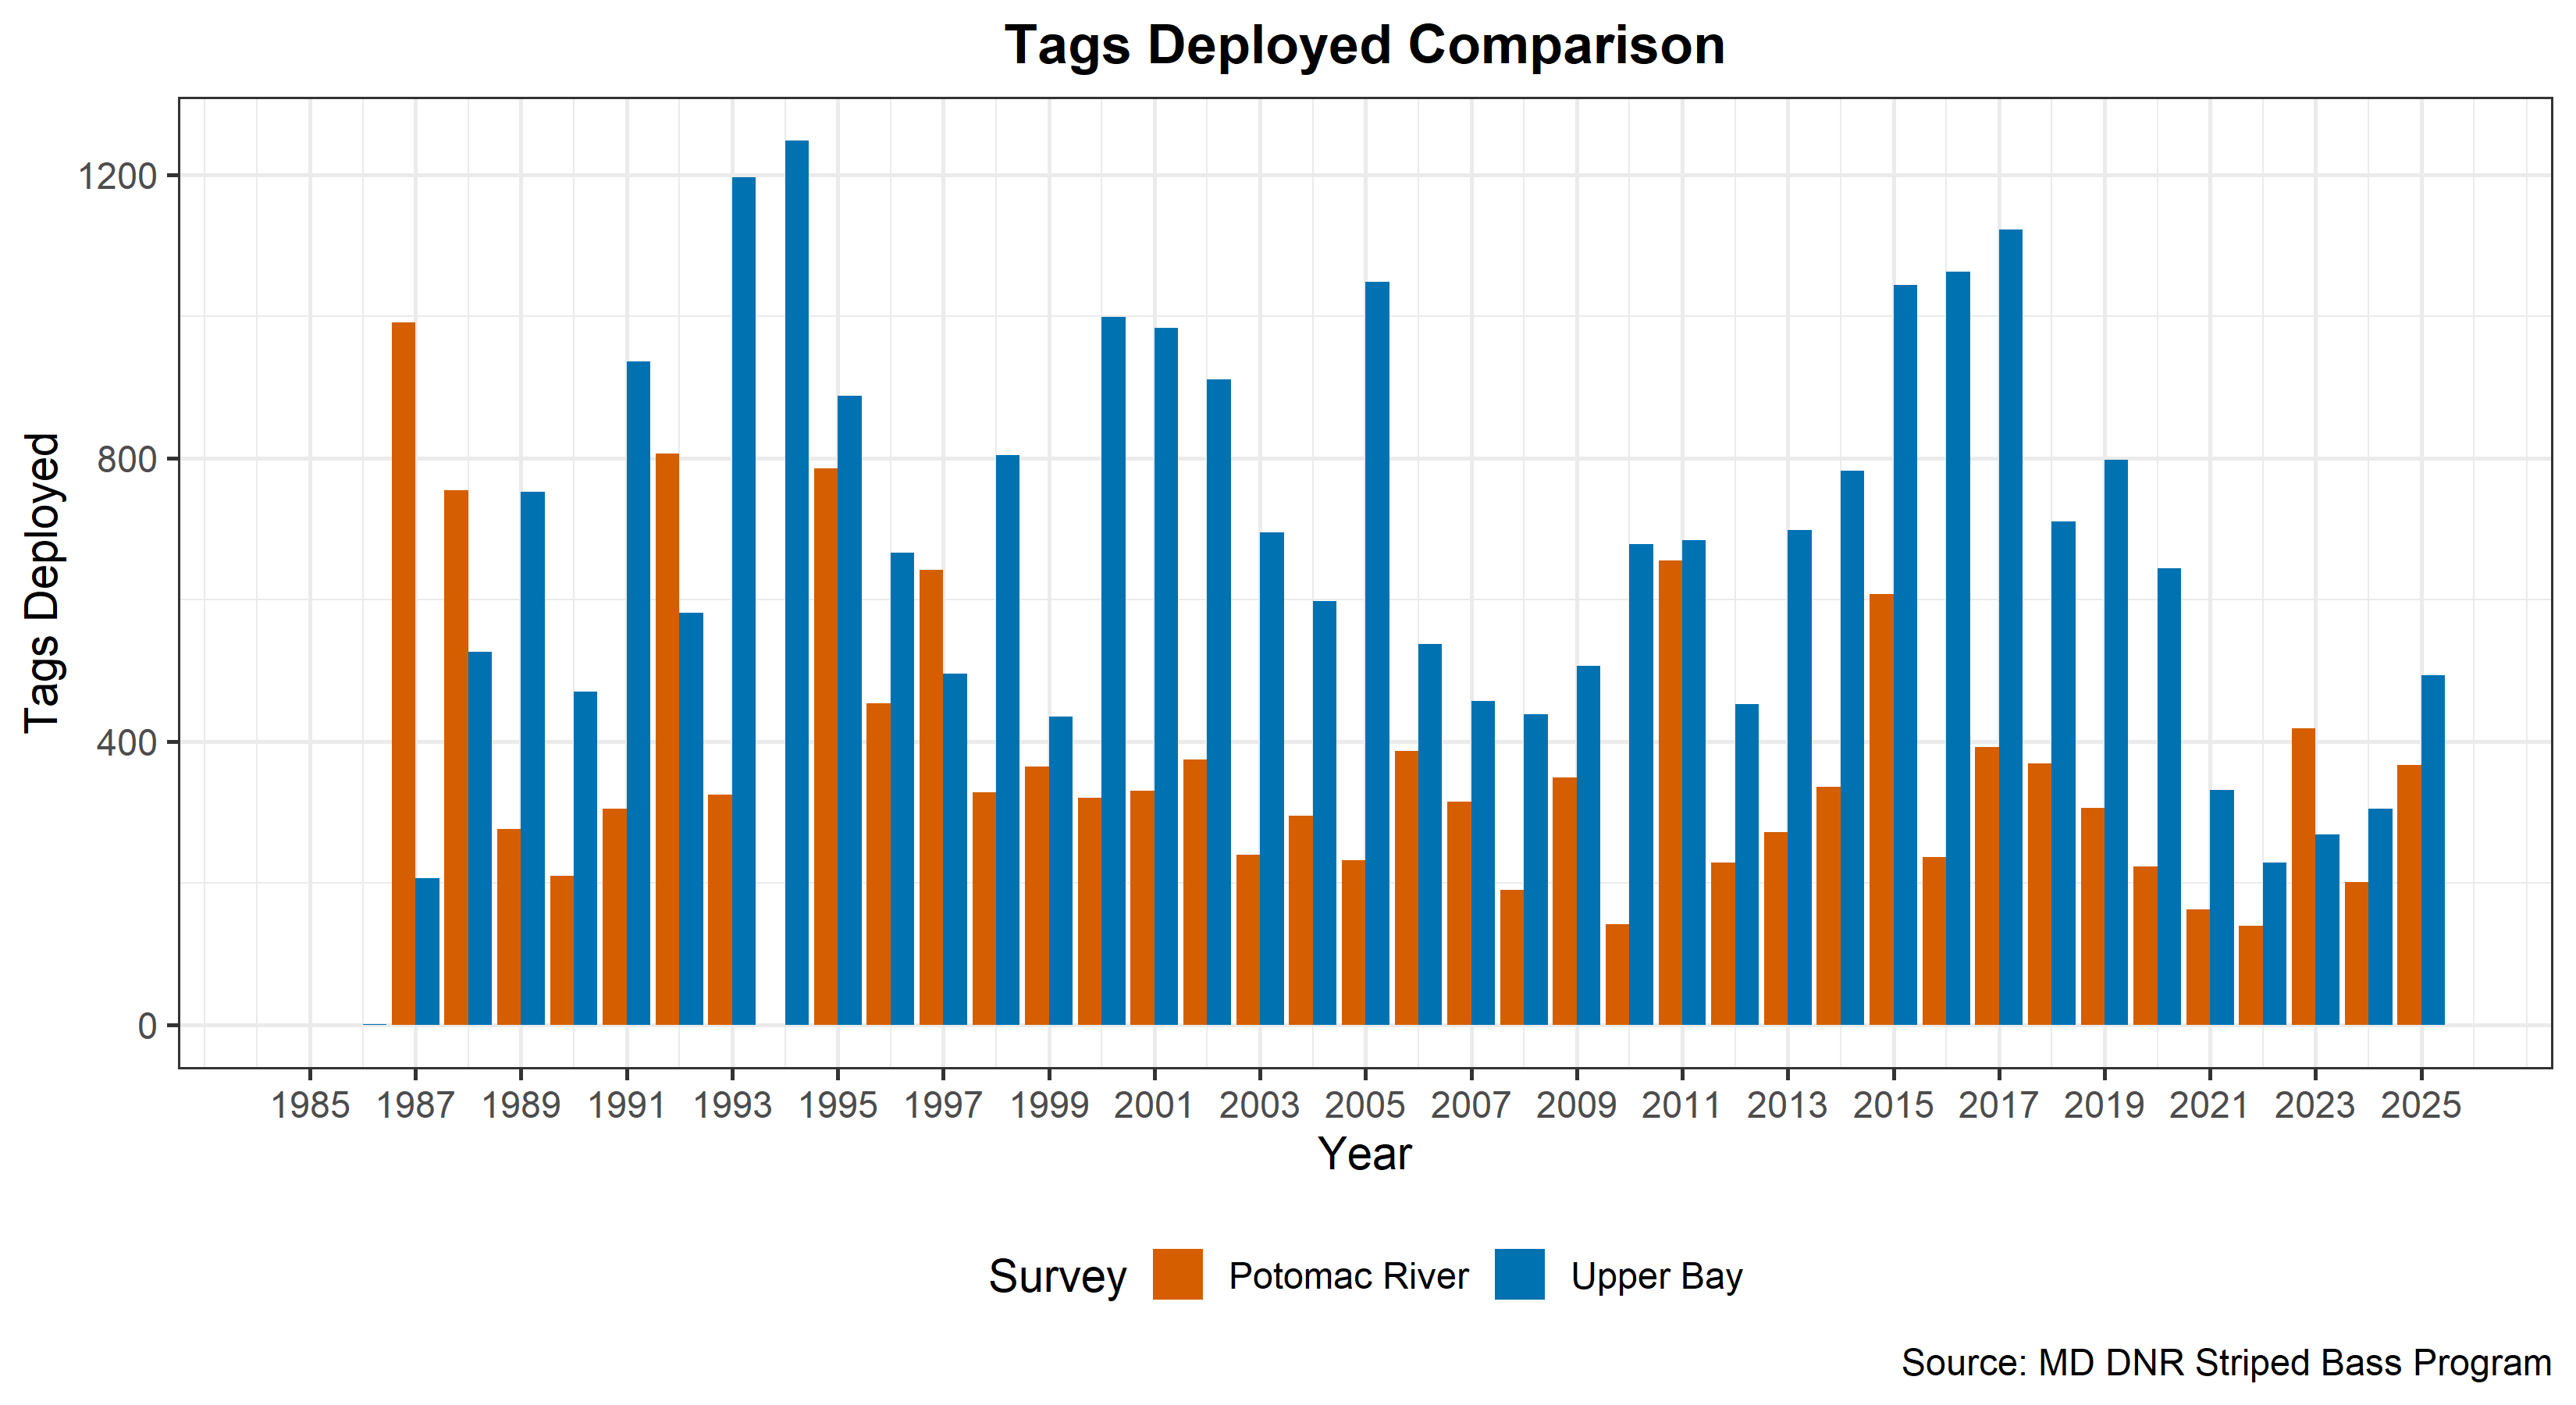
This clustered bar chart shows annual tagging volume for striped bass in the Potomac River and Upper Chesapeake Bay from 1985 to 2025. Historically, tagging in the Upper Chesapeake Bay (blue bars) has frequently exceeded 800 tags per year, peaking above 1,200 in the early 1990s. The Potomac River survey (gold bars) generally shows lower annual totals, typically ranging between 200 and 800 tags. Both surveys show a relative decline in tags deployed since 2018, with 2025 showing a slight increase in the Upper Bay. Detailed annual values are available in the accompanying data table.
View accessible data table for Tag Deployed Comparison Striped Bass Spawning Stock Survey (tab Tag Comparison).
