Services from Human Capital
(billions 2012 $)
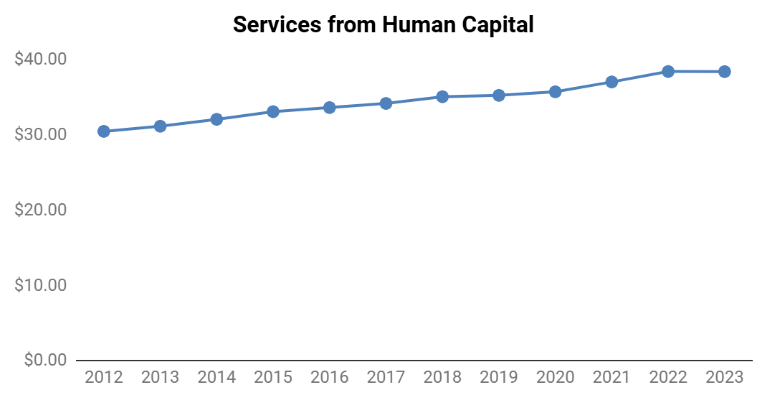
What are we measuring?
We get many benefits from human knowledge and creativity, which can be measured through investment in the arts, libraries, and benefits derived from higher education.
Trends 2012-2023
As a category, Services from Human Capital increased by 26% from 2012 to 2023. Services from higher education increased a similar percentage during that time period, which makes up over 95% of this category. Services from the arts and library services declined around 25% over this period.
-
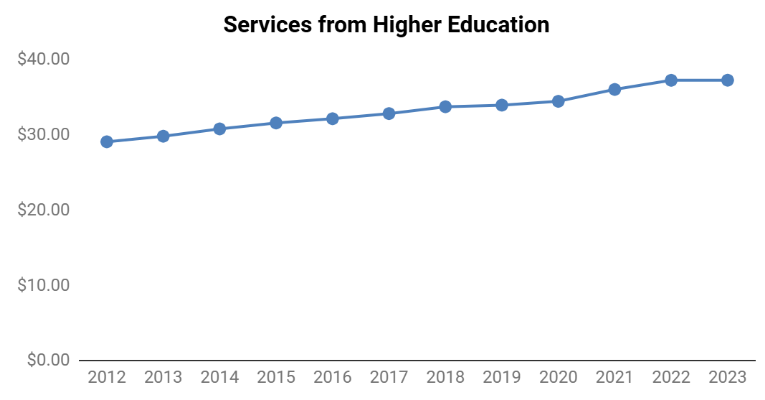
Higher Education
Services from higher education increased by 28% from 2012 to 2023. Maryland Ready - a state plan for post secondary education - along with other programs to aid students in finances and accessibility, contributed to the increasing percentage of Marylanders with Bachelor or advanced degrees over this period.
Calculation
The calculation of benefits from higher education has been maintained from GPI 1.0,
please refer to this page for methodology.
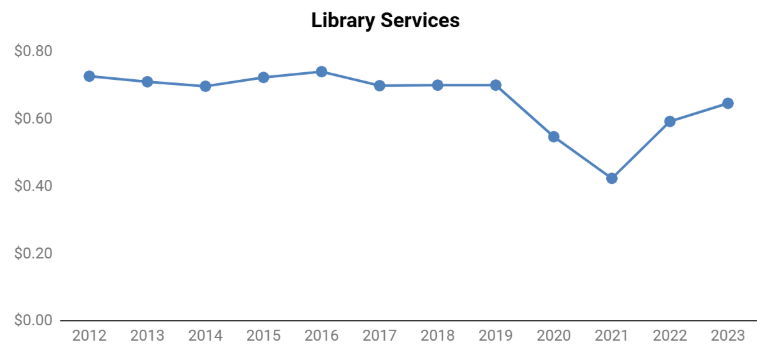
These benefits do not include additional wages, as this would potentially double count with budget expenditures, but are “spill-over” benefits, which include a lower rate of criminal activity, higher rates of community participation and volunteerism, and better health. The benefits from libraries are calculated by estimating the market value of materials circulated by the Maryland public library system.
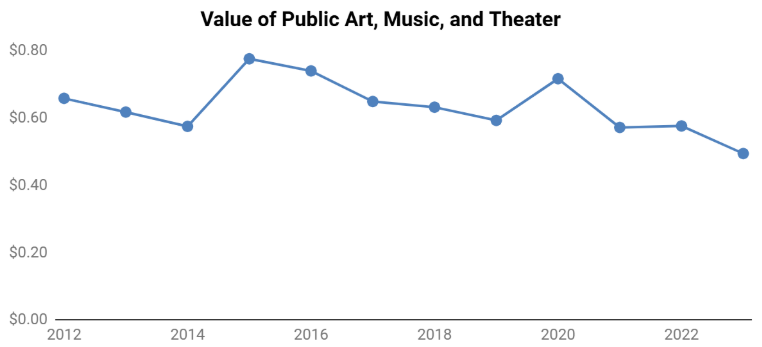
Circulation statistics retrieved from here and the market values were conservatively estimate as $15 per book, $14 per audiobook, $3 per video, $4.50 per periodical, and $9 per miscellaneous media. The only spending on the arts considered here is by non-profits, again to avoid double counting with household and governmental expenditures. These data are taken from the
Arts & Economic Prosperity 6 report from Americans for the Arts.
