Maryland Genuine Progress Indicator

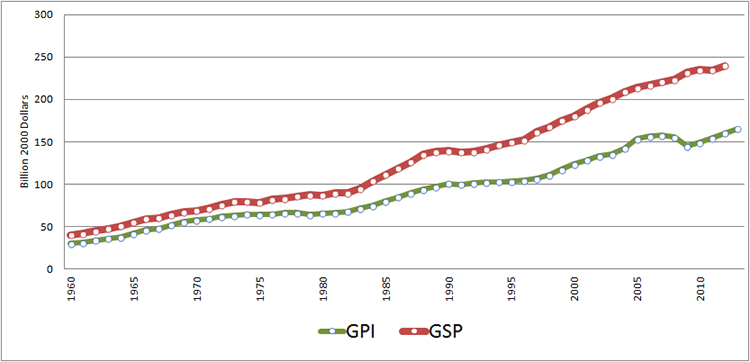
Consistent with other States and nations, Maryland's GPI is near the States
GSP until the early 1980s wherein they begin to separate. Because of our many
strengths and resources, though, Maryland's GPI continuously rises and continues to improve.
Maryland Genuine Progress Indicators Categories

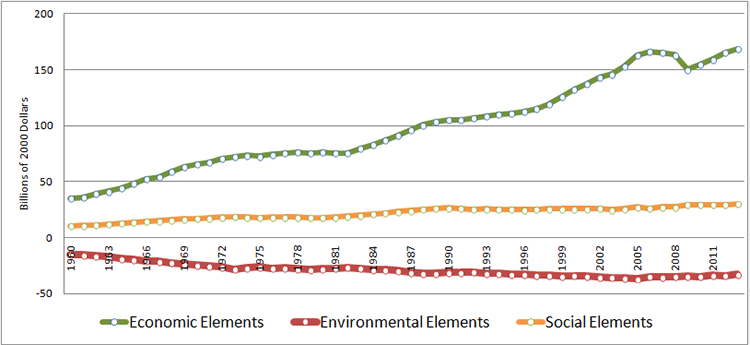
The MD-GPI is the comprised of 26 Indicators that are within three
Categories: Economic, Environmental, and Social. The graph above shows the trend
of the sum of all Indicators per Category. The indicators labeled "costs" are subtracted while the other indicators labeled "value of" are added in the GPI equation.
The Economic Category fairly well mirrors the Gross State Product (GSP). The
Environmental Category is below 0 because those Indicators are subtracted from
the GSP, and therefore negative. Though, because of Marylands commitment to our
natural resources, aggregate environmental conditions are improving. While
generally increasing, the Social Category is flatter because some Indicators are
added while others are subtracted, thereby cancelling each other when
collectively shown.