Depletion of Natural Capital
(billions 2012 $)
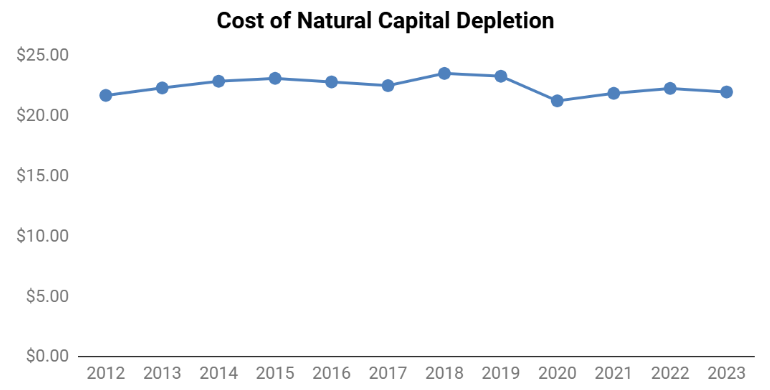
What are we measuring?
This indicator measures the cost associated with using non-renewable resources and losing natural lands. When we lose farmlands, wetlands, and forests we lose the future ability of these lands to produce goods and services. Nonrenewable resources like fossil fuels and groundwater are used at an unsustainable rate will need to be replaced by future generations, and we account for this cost of replacement in the GPI.
Trends 2012-2023
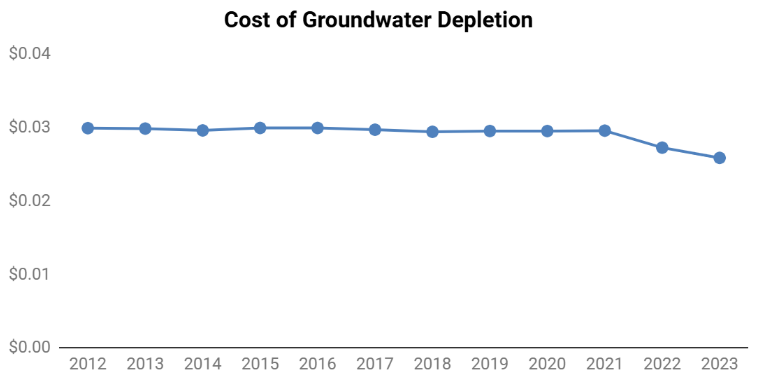
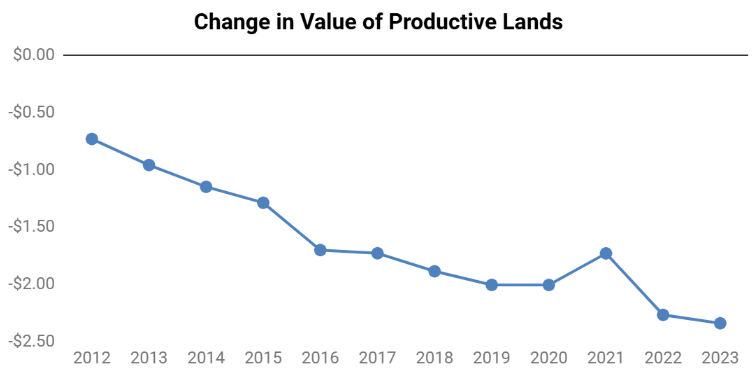
Groundwater depletion is not currently a significant problem in Maryland; only one aquifer in southern Maryland was determined to be being used at an unsustainable rate. Maryland forest land and coastal wetlands decreased yearly from 2012-2023 at an assumed rate from federal and state data sources. Freshwater wetlands increased slightly over time.
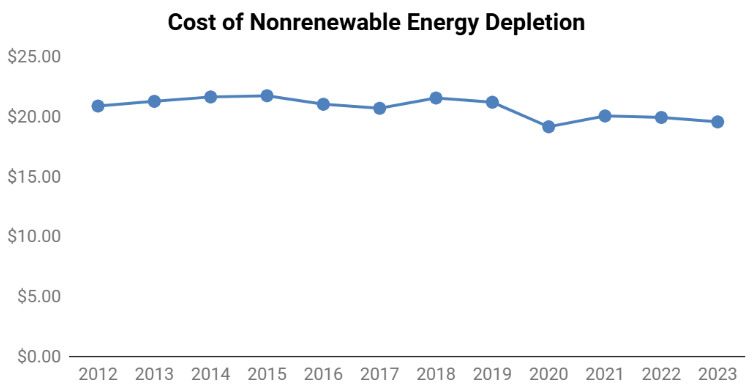
The cost of non-renewable energy depletion, as quantified by the cost of replacing the non-renewable energy use by renewable alternatives, decreased by 6% or $1.3 billion over 2012-2023, reflecting a decline in electricity generated by fossil fuels. The cost from loss of natural lands increased by $1.6 billion over the same period, resulting in a slight increase in the overall category of 1.3%.
Calculation
Methodology for the cost of nonrenewable depletion was maintained from
GPI 1.0 (see page), although the cost of electricity from solar and was updated to be $0.13 per kwh, to reflect current
average unsubsidized cost. Potentially unsustainable groundwater usage in the state was taken from the Maryland Geological Survey (MGS OPEN-FILE REPORT NO. 14-02-02). The replacement cost was estimated to be $9.61 per 1000 gallons, the current rate for high usage water customers in Charles County, the only county in Maryland projected to have potential groundwater supply problems by 2030. The rates of change in natural lands were derived from the same sources in the ecosystem calculation, the
University of Maryland Global Forest Change) for forests and the Maryland Department of the Environment for freshwater and coastal wetlands. The value of these land types was estimated as the net present value of the ecosystem services they provide over 50 years, using a 2.5% social discount rate.
