Costs of Income Inequality
(billions 2012 $)
What are we measuring?
The cost of income inequality is based on the economic phenomena of declining marginal utility of income, which essentially means that people on the high end of the income spectrum get less usefulness out of an increase in earnings. For instance, a person earning $15,000 a year getting a $1000 dollar raise would mean a great deal to their quality of life, allowing them to purchase additional groceries and perhaps health insurance. Whereas a $1000 dollar raise for someone earning $200,000 a year would mean very little in terms of their everyday life and consequently have very little impact on their experienced well-being.
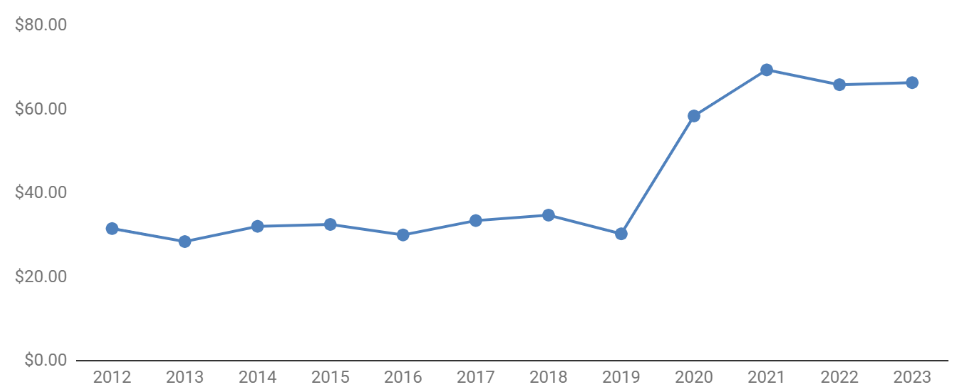
Trends 2012-2023
The cost of income inequality increased dramatically from 2012 to 2023 by over nearly 110%. Recent increases in this cost have been dramatic, particularly in 2020 where it rose nearly 100%. This can be seen as an indicator that lower income earners saw greater impacts under the COVID-19 pandemic, although these levels have persisted in the following years as well.
Calculation
The cost of income inequality is calculated using equations from Layard et al. 2008 of the marginal utility of income. The marginal utility of additional income declines as total household income increases, beginning at household incomes greater than 79,000 per year and peaking at the top income bracket considered, $1.2 million being equivalent to $277,000 when adjusted for utility. Please refer to Layard et al. 2008 for detailed methodology.
Layard, R., Nickell, S., Mayraz, G. 2008. The marginal utility of income. Journal of Public Economics 92 (2008) 1846–1857.
http://darp.lse.ac.uk/papersdb/Layard_etal_(JPubEcon08).pdf
