There are three important sources for measuring forest and tree canopy in Maryland:
The University of Maryland Analysis of Tree Canopy for 2011
(a digital raster map product).
This data estimates that there is nearly 3.095 million acres of tree canopy in Maryland, or nearly 50% of total land area.
The Chesapeake Conservancy High Resolution Land Cover Assessment for 2013 (a digital raster map product)
The tree canopy estimate from this data is approximately 3.168 million acres, or 51% of total land area.
The US Forest Service Inventory and Analysis (FIA) Annual Summary of Permanent Plots in Maryland
Forest area from this data is estimated at 2.462 million acres in 2016 or nearly 40% of total land area.
- Timeframe: 2016, but “full report” consists of data from any seven year period.
- User Accuracy: Data for 2016 has a Percent Sample Error of 2.3% (at the state level) from a 68% confidence interval.
- Resolution: The FIA considers a forest to be 1 acre of trees, with at least 10% canopy coverage, and is at least 120 feet wide.
- Tree height threshold: N/A
- Planned Updates: Methodology is consistent across the country and updated annually.
- Downloadable: The latest report is for 2016 and is available at https://www.fs.fed.us/nrs/pubs/ru/ru_fs136.pdf
Customized report can be created using the DATIM tool available at https://apps.fs.usda.gov/datim/atim/Default.aspx
- Contact: Maryland’s FIA contact is Tonya Lister, Research Forester, USDA Forest Service, tlister01@fs.fed.us
- Additional Information: https://www.fia.fs.fed.us/
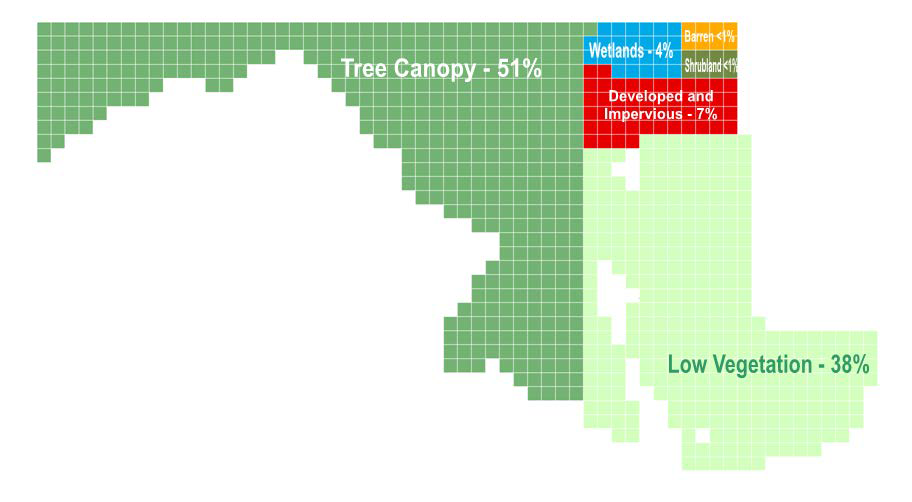
Figure 1: The relative percent of 6 different land cover types in Maryland. If all of the land cover types were placed together, this is what it would look like. Based on the Chesapeake Conservancy Land Cover Assessment for 2013.
Comparison of the High Resolution Data Products to Previous Methods
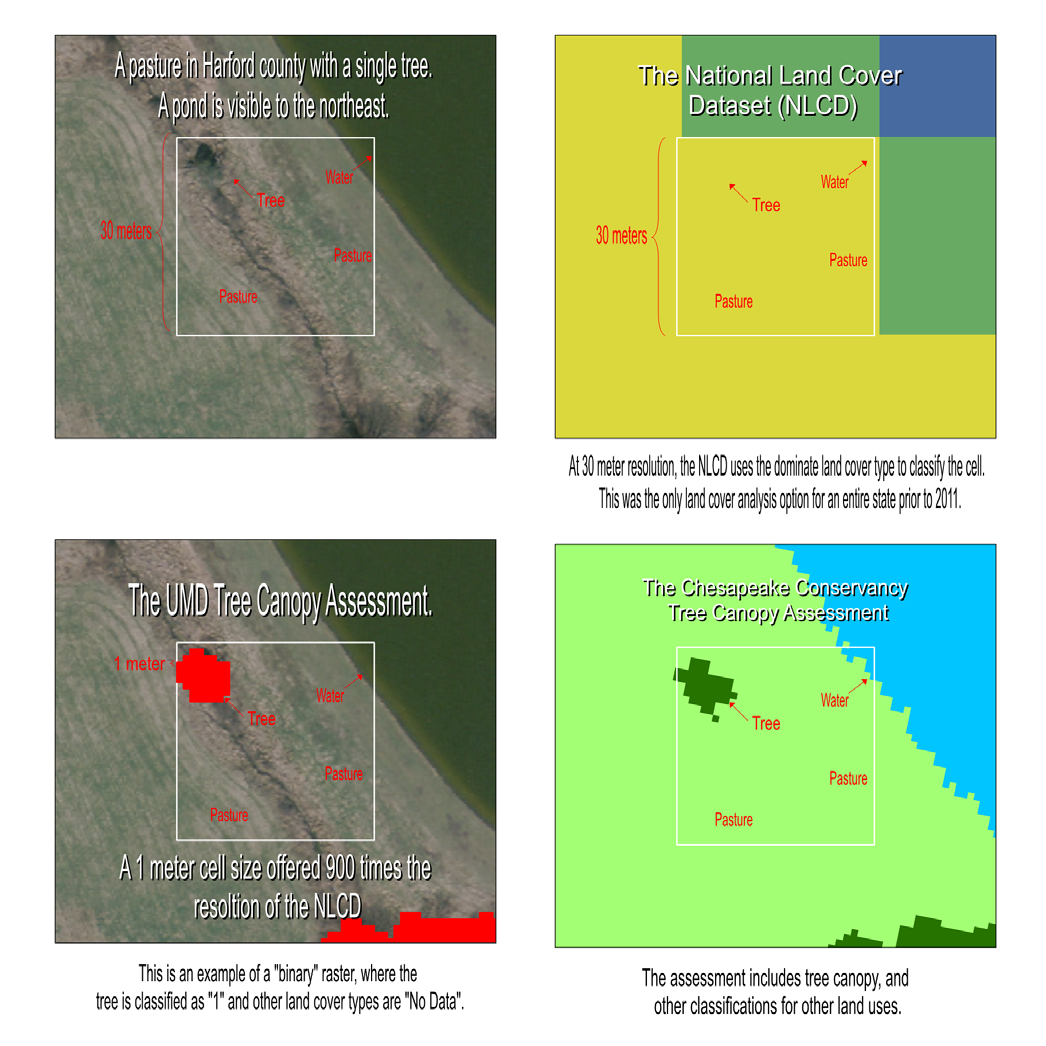
Figure 2: Comparison of two high resolution tree canopy mapping methods (bottom left and right) to the National Land Cover Dataset (NLCD, top right). With 900 times the resolution, the UMD and Chesapeake Conservancy Data can provide decision makers with very accurate and precise information at the local level.
Forest vs. Tree Canopy
Often the terms Forest and Tree Canopy (or Tree Cover) are used interchangeably, but this is incorrect, and they have two very unique definitions. Tree Canopy is any area covered by trees when viewed from above. This includes forests, trees in a yard or park, trees in an urban setting, orchards, and trees where animal grazing or other agricultural operations may be taking place below. On the other hand, Forest is a subtype of tree canopy, and is defined by the US Forest Service as: An area of trees with at least 10% tree canopy cover that is at least 1 acre in size, is at least 120 feet wide when measured from stem to stem.
Forest land includes transition zones, such as areas between forest and nonforest lands that meet the minimal tree stocking/cover and forest areas adjacent to urban and built—up lands. Roadside, streamside, and shelterbelt strips of trees must have a width of at least 120 feet and continuous length of at least 363 feet to qualify as forest land. Unimproved roads and trails, streams, and clearings in forest areas are classified as forest if they are less than 120 feet wide or less than an acre in size. Tree-covered areas in agricultural production settings, such as fruit orchards, or tree—covered areas in urban settings, such as city parks, are not considered forest land.
--US Forest Service, National Core Field Guide, Version 6.0, October, 2012
Examples of Forest vs. Tree Canopy
Figure 3: Shows examples of how forest and tree canopy are similar and different. The green ground represents area under trees that is mowed or grazed. Orchards and silvapasture areas are not considered forest.
Figure 4: Shows the types of openings that can occur that will change a forest designation. Water bodies are generally considered part of the forest.
Figure 5: Shows a cut-over area within a forest. This area has had the tree canopy removed, but is still considered part of the forest, as its land-use designation has not changed — it is being managed as a new forest. However only the surrounding areas are counted as tree canopy, until a tree canopy develops in the cleared area.
University of Maryland Tree Canopy
This data is intended to make maps, identify trees and tree canopy, very precisely at many scales, but primarily at the county level. It was created as a byproduct of the Carbon Monitoring System project by the Geography Department of the University of Maryland, funded by a grant from NASA. This data can be placed on a map to depict individual or groups of trees and tree canopy. This data utilizes LiDAR data from 2003 to 2012, and 2011 NAIP Imagery, to produce a 1 meter resolution tree canopy binary raster data layer for each county in the state. This is done using an “object based analysis”, utilized by Jarlath O’Neil-Dunne and the Department of Geography at the University of Vermont. LiDAR provides the height, while NAIP Imagery from 2013 provides the background color information. Thus a tall, green object has a high probability of being a tree. The tree canopy analysis represents a very accurate and precise “snapshot” of tree canopy in the year 2011. The data takes the form of a binary raster that can be used by commercial mapping software.
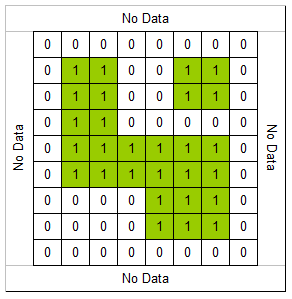
Figure 6: A binary raster used as a digital map image. “1” represent trees and “0” represents other land-uses. Cells are 1 meter x 1 meter square.
Figure 7: A view of the tree canopy (red) around Clarksville, Maryland in 2007 from the University of Maryland tree canopy assessment.
Figure 8: A view of the various land cover types around Clarksville, Maryland in 2013 from the Chesapeake Conservancy High Resolution Land cover Project. Major tree canopy types are shown as dark green and yellow.
Chesapeake Conservancy Tree Canopy
This data is also intended to make maps, identify trees and tree canopy very precisely at many scales, primarily at the county level. This data can be placed on a map to depict individual or groups of trees and tree canopy. It is a raster dataset with 1 meter resolution land cover assessment with 11 land classes, and was created using the same basic methodology as the UMD tree canopy data; an “object based analysis”. Tree canopy is a class, with additional tree canopy classes including “tree canopy over impervious”, “tree canopy over structure”, and “tree canopy over impervious roads”. These are grouped together to provide an estimate of total tree canopy. This data utilizes LiDAR data from various years, but generally 2012 to 2015, and sometimes in combination with other years. More information is available in the User Guide.
US Forest Service, Forest Inventory and Analysis (FIA) Forest Data
Since 1929, the US Forest Service has been periodically collecting information about America’s forests, and this task falls to the Forest Service’s Forest Inventory and Analysis unit. The 1998 Farm Bill now requires the US Forest Service to collect data every year. This inventory is different from the digital data described above; field crews collect data from sample plots arranged across the state. It is not capable of measuring the tree canopy, but instead focuses on forest area, and collecting information about the forest.
There are over 900 permanent sample plots across the state, and the trees in these plots are measured at least every 7 years. Using statistics, the information for each plot is expanded to represent 6,000 acres of the surrounding forest. For example, if 2 of the plots were forested on a previous survey have been developed into houses, it can be interpreted as 12,000 acres of forest loss. Keep in mind, the UMD and Chesapeake Conservancy data sets are measures of tree canopy area, and FIA only measures forest. The data collected by FIA crews is invaluable, and tells us about the forest’s composition, age, structure, health, value, and much more. FIA derived data for Maryland can be accessed through the US Forest Service’s Design and Analysis Toolkit, or DATIM tool. Reports about the FIA forest sample data can be selected or created using the tool.
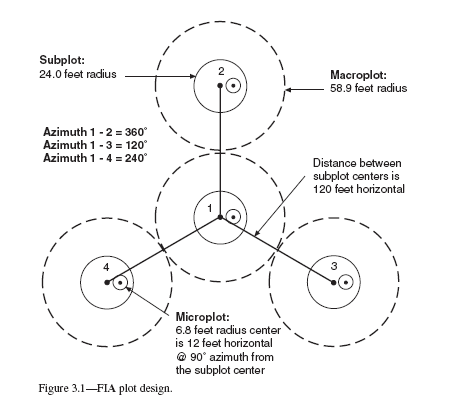
Figure 9: A graph of the forest cover area over time in Maryland. The FIA data (light green) is compared to estimates of forest area from the Maryland Department of Planning. Note the largely stable trend between 2008 and 2016, thought to have been caused by the financial crisis of 2008, and subsequent slowing of new construction.
How Does FIA Work?
For Maryland, 985 permanent sample plots exist across the state. FIA field crews get permission from landowners to access the plot, and record the data. To protect the privacy of the landowner, the location and content of the plots are confidential. Of these plots, 432 were forested in 2016, and the current report represents data collected from 2011 to 2016. All of the plots are visited once in 7 years, with roughly 1/7 of all plots in a state being sampled in a single year. For a time, the plots were sampled every five years, but budgetary constraints forced the US Forest Service to reduce the number of field staff, and extend the sampling period.
