INTRODUCTION:
 The winter dredge survey is the only bay-wide fishery-independent effort to estimate the number of blue crabs living in the Chesapeake Bay. The winter dredge survey produces information that is essential for the management of the species, such as an estimate of the number of crabs over-wintering in the bay and the number of young crabs entering the population each year. Also calculated is the estimated number of females that could spawn within the year, which is an important indicator of future spawning potential. Estimating the total number of crabs living in the bay allows us to calculate the percentage of the crab population that is removed by harvest each year. A pilot version of the winter dredge survey was first conducted in 1988 with the cooperation of the University of Maryland Chesapeake Biological Lab. In 1989 the Virginia Institute of Marine Science joined the survey, and the two states continue to sample each winter from December through March.
WHERE WE SAMPLE:
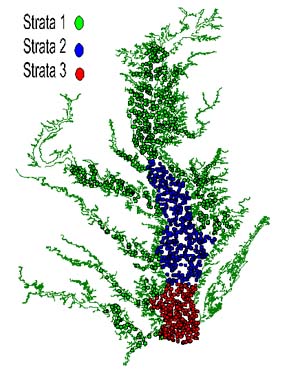
 Since 1994, the survey has been conducted according to a stratified random design
(Rothschild and Sharov, 1996). The bay is divided into three regions or strata: Lower Bay (the mouth of the Chesapeake to Windmill Point, VA), Middle Bay (Windmill Point, VA to Cove Point, MD) and the Upper Bay/Tributaries (Cove Point to Pooles Island and all of the Bay's tributaries). Each year, a total of 1500 sites in waters deeper than 5 feet are randomly selected. The number of sites assigned in each region is proportional to its area.
HOW WE SAMPLE:
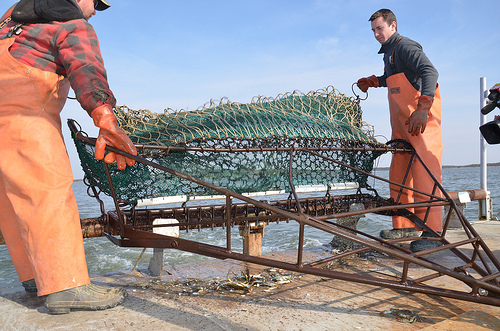
A six-foot-wide Virginia crab dredge fitted with a half-inch nylon mesh liner is towed along the bottom for one minute at a speed of three knots. Latitude and longitude, measured with a Differential Global Positioning System (GPS), is recorded at the beginning and end of each tow to determine distance covered. This distance is multiplied by the dredge's width to calculate the area covered. Beginning and ending depth, water temperature, and salinity are recorded at each site.
All crabs collected at each site are measured and weighed. Crabs are measured from point to point across the top shell or carapace. The sex of each crab is determined and the maturity of females is noted.
As a final part of our survey, we do annual experiments to determine how well our dredge catches blue crabs. This is known as gear efficiency. For more information see:
Volstad et al. 2000 and Sharov et al. 2001.
HOW AND WHY WE DETERMINE THE AGE OF CRABS:
We divide the male and female crabs into different categories based on age, size, and maturity. Crabs that are smaller than 2.4 inches across the carapace are considered to be
young-of-the-year crabs. These are the new arrivals to the bay and will form the backbone of the recreational and commercial fisheries in the late summer or fall. Female crabs bigger than 2.4 inches across are the females that could spawn this year. The number of spawning females is related to the number of young crabs that can potentially be produced each year and is an important indicator of the health of the stock. Combined, all crabs bigger than 2.4 inches are grouped together and considered to be the
harvestable stock for the upcoming year. These crabs will support the recreational and commercial fisheries throughout the summer.
CALCULATING THE NUMBER OF CRABS:
The results of the winter dredge survey are reported as density of crabs. This is the average number of crabs we find within a 1,000 meter by 1,000 meter area (1,000 meters squared or 1000m2). The density of crabs for the different age categories is calculated each year. See a table of different age class densities for 1990 to 2025.
The figures below show the annual density since 1990 for important age categories as well as the densities of all age categories combined.
-
- The density of juvenile crabs decreased in 2025 (Figure 1). The density of crabs bigger than 2.4 inches decreased slightly in 2025 (Figure 2).

-

- The density of male crabs greater than 5 inches decreased in 2025 (Figure 3).

-
The density of spawning females decreased slightly in 2025 (Figure 4).

-
Overall, total crab density decreased in 2025 (Figure 5).

HOW MANY CRABS ARE ESTIMATED TO BE LIVING IN THE BAY?
Managers estimate abundance, the number of crabs estimated to be living in the Chesapeake Bay, by multiplying the density of all crabs by the area of the bay. Each year the overwintering mortality, those crabs that die in the winter, is estimated and abundance is adjusted for that loss.
Juvenile abundance and total crab abundance decreased in 2025.


In 2017 an update to the blue crab stock assessment recommended a female-specific target of 196 million spawning age female crabs and a threshold of 72.5 million spawning age female crabs that were adopted by Maryland, Virginia, and the Potomac River Fisheries Commission. In 2025 the abundance of spawning age females decreased to 108 million crabs, which is above the recommended threshold of 72.5 million crabs.

The total estimated number of crabs living in the bay for each year of the survey is listed below:
| Year | Millions of Crabs | Year | Millions of Crabs | Year | Millions of Crabs |
|---|
| 1990 | 791 | 2002
| 315
| 2014
| 297
|
| 1991 | 828 | 2003
| 334
| 2015
| 411
|
| 1992 | 367 | 2004
| 270
| 2016
| 553
|
| 1993 | 852 | 2005
| 400 | 2017
| 455
|
| 1994 | 487 | 2006
| 313
| 2018
| 371
|
| 1995 | 487 | 2007
| 251
| 2019
| 594
|
| 1996 | 661 | 2008
| 293 | 2020
| 405
|
| 1997 | 680 | 2009
| 396
| 2021
| 282
|
| 1998 | 353 | 2010
| 663
| 2022
| 227
|
| 1999 | 308 | 2011
| 452
| 2023
| 323
|
| 2000 | 281
| 2012 | 765
| 2024
| 317
|
2001
| 254
| 2013
| 300
| 2025
| 238
|
The estimated number of spawning age female crabs living in the bay for each year of the survey is listed below:
| Year | Millions of Crabs | Year | Millions of Crabs | Year | Millions of Crabs |
|---|
| 1990 | 117
| 2002
| 55
| 2014
| 69
|
| 1991 | 227
| 2003
| 84
| 2015
| 101
|
| 1992 | 167
| 2004
| 82
| 2016
| 194
|
| 1993 | 177
| 2005
| 110
| 2017
| 254
|
| 1994 | 102
| 2006
| 85
| 2018
| 147
|
| 1995 | 80
| 2007
| 89
| 2019
| 191
|
| 1996 | 108
| 2008
| 91
| 2020
| 141
|
| 1997 | 93
| 2009
| 162
| 2021
| 158
|
| 1998 | 106
| 2010
| 246
| 2022
| 97
|
| 1999 | 53
| 2011
| 191
| 2023
| 152
|
| 2000 | 93
| 2012 | 95
| 2024
| 133
|
2001
| 61
| 2013
| 147
| 2025
| 108 |
The estimated number of
juvenile crabs living in the bay for each year of the survey is listed below:
| Year | Millions of Crabs | Year | Millions of Crabs | Year | Millions of Crabs |
|---|
| 1990 | 463
| 2002
| 194
| 2014
| 199
|
| 1991 | 356
| 2003
| 172
| 2015
| 269
|
| 1992 | 105
| 2004
| 143
| 2016
| 271
|
| 1993 | 503
| 2005
| 242
| 2017
| 125
|
| 1994 | 295
| 2006
| 196
| 2018
| 167
|
| 1995 | 300
| 2007
| 112
| 2019
| 324
|
| 1996 | 476
| 2008
| 166
| 2020
| 185
|
| 1997 | 512
| 2009
| 170
| 2021
| 86
|
| 1998 | 166
| 2010
| 348
| 2022
| 101
|
| 1999 | 223
| 2011
| 204
| 2023
| 116
|
| 2000 | 135
| 2012 | 581
| 2024
| 138
|
2001
| 156
| 2013
| 111
| 2025
| 103 |