Explore and Restore Maryland Streams
Main_Content
Sharing and Analyzing Data – Tools for Inquiry
Check out the data students in Maryland are collecting on this
map:
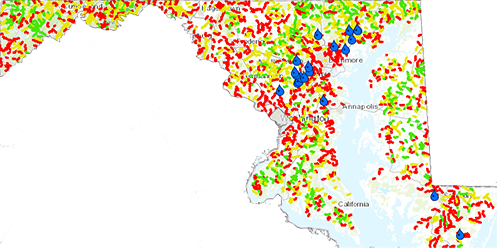
Would you like to add stream data to the map?
Please submit your data to the Explore and Restore Maryland Streams map
Here.
-
MERLIN -
Interactive Maps. This is the online mapping repository
for spatial data
for the Maryland Department of Natural Resources. Explore Maryland virtually with your students and identify your closest stream, where it leads, and the varied natural resources that surround your school and community.
-
Fieldscope provides a web-based mapping, analysis, and collaboration tool designed to support geographic investigations and to engage students as citizen scientists investigating real-world issues – both in the classroom and in outdoor educational settings. They have both a
regional and a
Maryland specific site.
- Investigate further using these
 Maryland Biological Stream Survey Investigations written by the
University of Maryland Center for Environmental Science to explore the relationship between water quality and human land use.
Maryland Biological Stream Survey Investigations written by the
University of Maryland Center for Environmental Science to explore the relationship between water quality and human land use.
- TheMaryland’s Water Monitoring Site Mapper is a map resource that displays where stream monitoring is occurring in Maryland. The map does not store monitoring data, but provides users with contact information about each site in case they would like to know more or possibly acquire the data. This site may be a great resource for finding community watershed stewardship groups who may want to partner or come speak with your students and school.
-
Monitoring Estuarine Water Quality, Data in the Classroom, National Estuarine Research Reserve System – This curriculum guide contains five activities designed for grades 6-8 that incorporate real data from the National Oceanic and Atmospheric Administration (NOAA). The activities are organized with five levels of increasing sophistication, from understanding how to access and interpret water quality data and how to look for patterns and changes over time, to examining the effects of physical water quality factors on species that live in a given environment. By the end of the module, students can continue to explore data sets driven by their own inquiry. Modules include reading water temperature data, understanding dissolved oxygen, introducing salinity and more.
-
Maryland Department of the Environment’s Water Quality Mapping Center provides access to surface water quality information in a geographic format. It provides mapped information on pH, bacteria, metals, nutrients, sediments and other pollutants.
