Forest Extent and Composition
Maryland’s forests cover 39% of the state, with nearly half the land area covered by trees when including urban and small patches. Although forest loss occurs due to development, state laws like the
Forest Conservation Act help slow this trend. Younger trees absorb carbon quickly, while mature forests store more carbon overall and provide critical wildlife habitat. Currently, most forests in Maryland are mature, supporting a healthy ecosystem but reducing early-growth habitats.
Forest Management and Ownership
Approximately 25% of Maryland’s forests are publicly owned, with 10% of the total forest area designated as permanently protected from harvesting. About 40% of
state-managed forestland—approximately 214,000 acres—is certified under recognized sustainable forestry standards such as FSC and SFI. Private landowners control the majority of Maryland’s forests, roughly 76%, primarily in small parcels under 10 acres. Only about 12 to 15% of private forest lands have formal management plans in place.
Watershed Protection and Tree Planting
Forests play a vital role in protecting the Chesapeake Bay by filtering sediment, nitrogen, and phosphorus from runoff.
Riparian buffers—trees along streams—trap pollutants before they reach waterways, reducing erosion and improving water quality. Since 1996, Maryland has planted over 1,400 acres of riparian buffers, fully protecting 57% of streams, with another 27% partially buffered. These efforts support the goals of the Chesapeake Bay Program and Maryland’s Forest Conservation Act. Initiatives like
Five Million Trees for Maryland continue to increase tree cover, helping to improve water quality and habitat across the state.
Climate and Carbon Benefits
Maryland’s forests absorb about 4.3 million metric tons of carbon dioxide equivalent annually, with urban trees adding another 2.2 million metric tons. Together, these natural carbon sinks help offset a significant portion of the state’s greenhouse gas emissions, supporting climate goals. Federal grants, including from the EPA’s Climate Pollution Reduction Fund, support projects that expand forest cover and improve forest health to boost carbon storage. Climate change is affecting forest growth in Maryland. Higher CO₂ levels and warmer, wetter winters and springs have increased growth rates, which enhances carbon uptake but also raises risks from pests, drought, and storms. Adaptive forest management is critical to sustaining forest health and carbon storage over time.
Forest Health and Risks
Maryland’s forests face ongoing threats from invasive pests and diseases. Since 2003, emerald ash borer has killed millions of ash trees across more than 80,000 acres. Beech leaf disease, first detected in 2017, is rapidly spreading and causing significant decline in American beech populations. Oak wilt continues to impact oak species across the state. Native pests like gypsy moth and southern pine beetle add further stress, especially during drought and extreme weather events. To manage these risks, Maryland focuses on monitoring pest outbreaks, removing infected trees, and controlling invasive species in both urban and rural areas. Maryland DNR and University of Maryland Extension provide landowners with guidance and resources to support proactive forest health management and reduce future vulnerabilities.
Forest Economy and Industry
Maryland’s forest economy has experienced a decline in recent years, with the total economic output falling from $4.7 billion in 2005 to $3.5 billion in 2015. Several factors have contributed to this downturn, including the closure of key facilities like the Luke Paper Mill in 2019, the loss of fumigation capabilities at the Port of Baltimore, and labor shortages affecting log transportation and processing. These challenges have led to fewer local processing options and reduced demand for timber products.Robust and stable markets are essential for the sustainability of Maryland’s forests. They provide landowners with economic incentives to maintain forest cover rather than converting land to other uses. Forest product markets also support rural jobs and contribute to the state’s economy. Emerging sectors such as woody biomass for thermal and electrical energy, poultry litter bedding, and carbon credit programs offer new opportunities to revitalize the industry.
Measuring Forests
Often the terms Forest and Tree Canopy (or Tree Cover) are used interchangeably, but this is incorrect, and they have two very unique definitions. Tree Canopy is any area covered by trees when viewed from above. This includes forests, trees in a yard or park, trees in an urban setting, orchards, and trees where animal grazing or other agricultural operations may be taking place below. On the other hand, Forest is a subtype of tree canopy, and is defined by the US Forest Service as: An area of trees with at least 10% tree canopy cover that is at least 1 acre in size, is at least 120 feet wide when measured from stem to stem.
Forest land includes transition zones, such as areas between forest and nonforest lands that meet the minimal tree stocking/cover and forest areas adjacent to urban and built—up lands. Roadside, streamside, and shelterbelt strips of trees must have a width of at least 120 feet and continuous length of at least 363 feet to qualify as forest land. Unimproved roads and trails, streams, and clearings in forest areas are classified as forest if they are less than 120 feet wide or less than an acre in size. Tree-covered areas in agricultural production settings, such as fruit orchards, or tree—covered areas in urban settings, such as city parks, are not considered forest land.
--US Forest Service, National Core Field Guide, Version 6.0, October, 2012
Figure 1: Shows a cut-over area within a forest. This area has had the tree canopy removed, but is still considered part of the forest, as its land-use designation has not changed — it is being managed as a new forest. However only the surrounding areas are counted as tree canopy, until a tree canopy develops in the cleared area.
Figure 2 A binary raster used as a digital map image. “1” represent trees and “0” represents other land-uses. Cells are 1 meter x 1 meter square.
Figure 3: A view of the tree canopy (red) around Clarksville, Maryland in 2007 from the University of Maryland tree canopy assessment.
University of Maryland Analysis of Tree Canopy for 2011
This data estimates that there is nearly 3.095 million acres of tree canopy in Maryland, or nearly 50% of total land area.
This data is intended to make maps, identify trees and tree canopy, very precisely at many scales, but primarily at the county level. It was created as a byproduct of the Carbon Monitoring System project by the Geography Department of the University of Maryland, funded by a grant from NASA. This data can be placed on a map to depict individual or groups of trees and tree canopy. This data utilizes LiDAR data from 2003 to 2012, and 2011 NAIP Imagery, to produce a 1 meter resolution tree canopy binary raster data layer for each county in the state. This is done using an “object based analysis”, utilized by Jarlath O’Neil-Dunne and the Department of Geography at the University of Vermont. LiDAR provides the height, while NAIP Imagery from 2013 provides the background color information. Thus a tall, green object has a high probability of being a tree. The tree canopy analysis represents a very accurate and precise “snapshot” of tree canopy in the year 2011. The data takes the form of a binary raster that can be used by commercial mapping software.
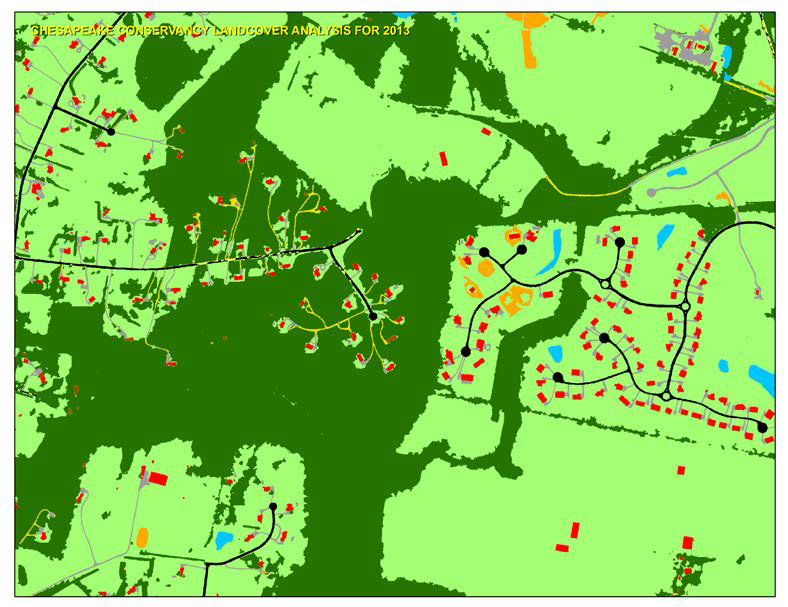
Figure 4: A view of the various land cover types around Clarksville, Maryland in 2013 from the Chesapeake Conservancy High Resolution Land cover Project. Major tree canopy types are shown as dark green and yellow.
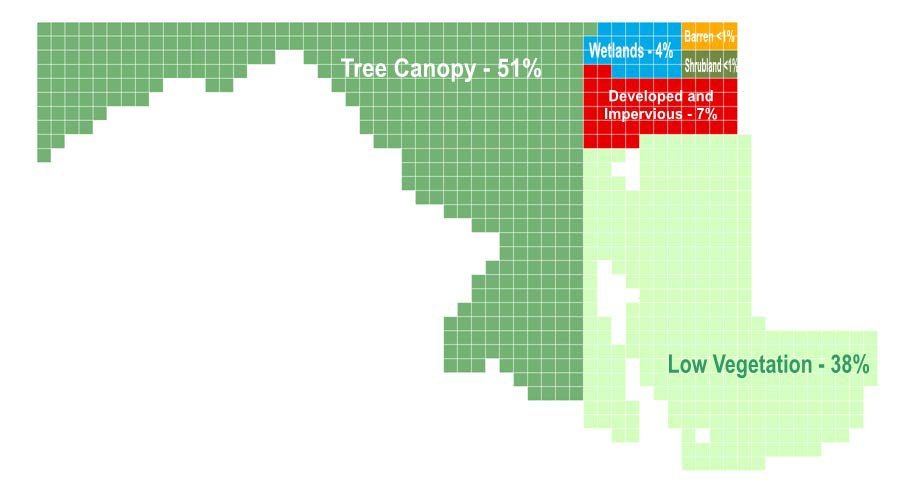
Figure 5: The relative percent of 6 different land cover types in Maryland. If all of the land cover types were placed together, this is what it would look like. Based on the Chesapeake Conservancy Land Cover Assessment for 2013.
Figure 6: A graph of the forest cover area over time in Maryland. The FIA data (light green) is compared to estimates of forest area from the Maryland Department of Planning. Note the largely stable trend between 2008 and 2016, thought to have been caused by the financial crisis of 2008, and subsequent slowing of new construction.
Chesapeake Conservancy High Resolution Land Cover Assessment for 2013
The tree canopy estimate from this data is approximately 3.168 million acres, or 51% of total land area.
This data is also intended to make maps, identify trees and tree canopy very precisely at many scales, primarily at the county level. This data can be placed on a map to depict individuals or groups of trees and tree canopy. It is a raster dataset with 1 meter resolution land cover assessment with 11 land classes, and was created using the same basic methodology as the UMD tree canopy data; an “object based analysis”. Tree canopy is a class, with additional tree canopy classes including “tree canopy over impervious”, “tree canopy over structure”, and “tree canopy over impervious roads”. These are grouped together to provide an estimate of total tree canopy. This data utilizes LiDAR data from various years, but generally 2012 to 2015, and sometimes in combination with other years. More information is available in the User Guide.
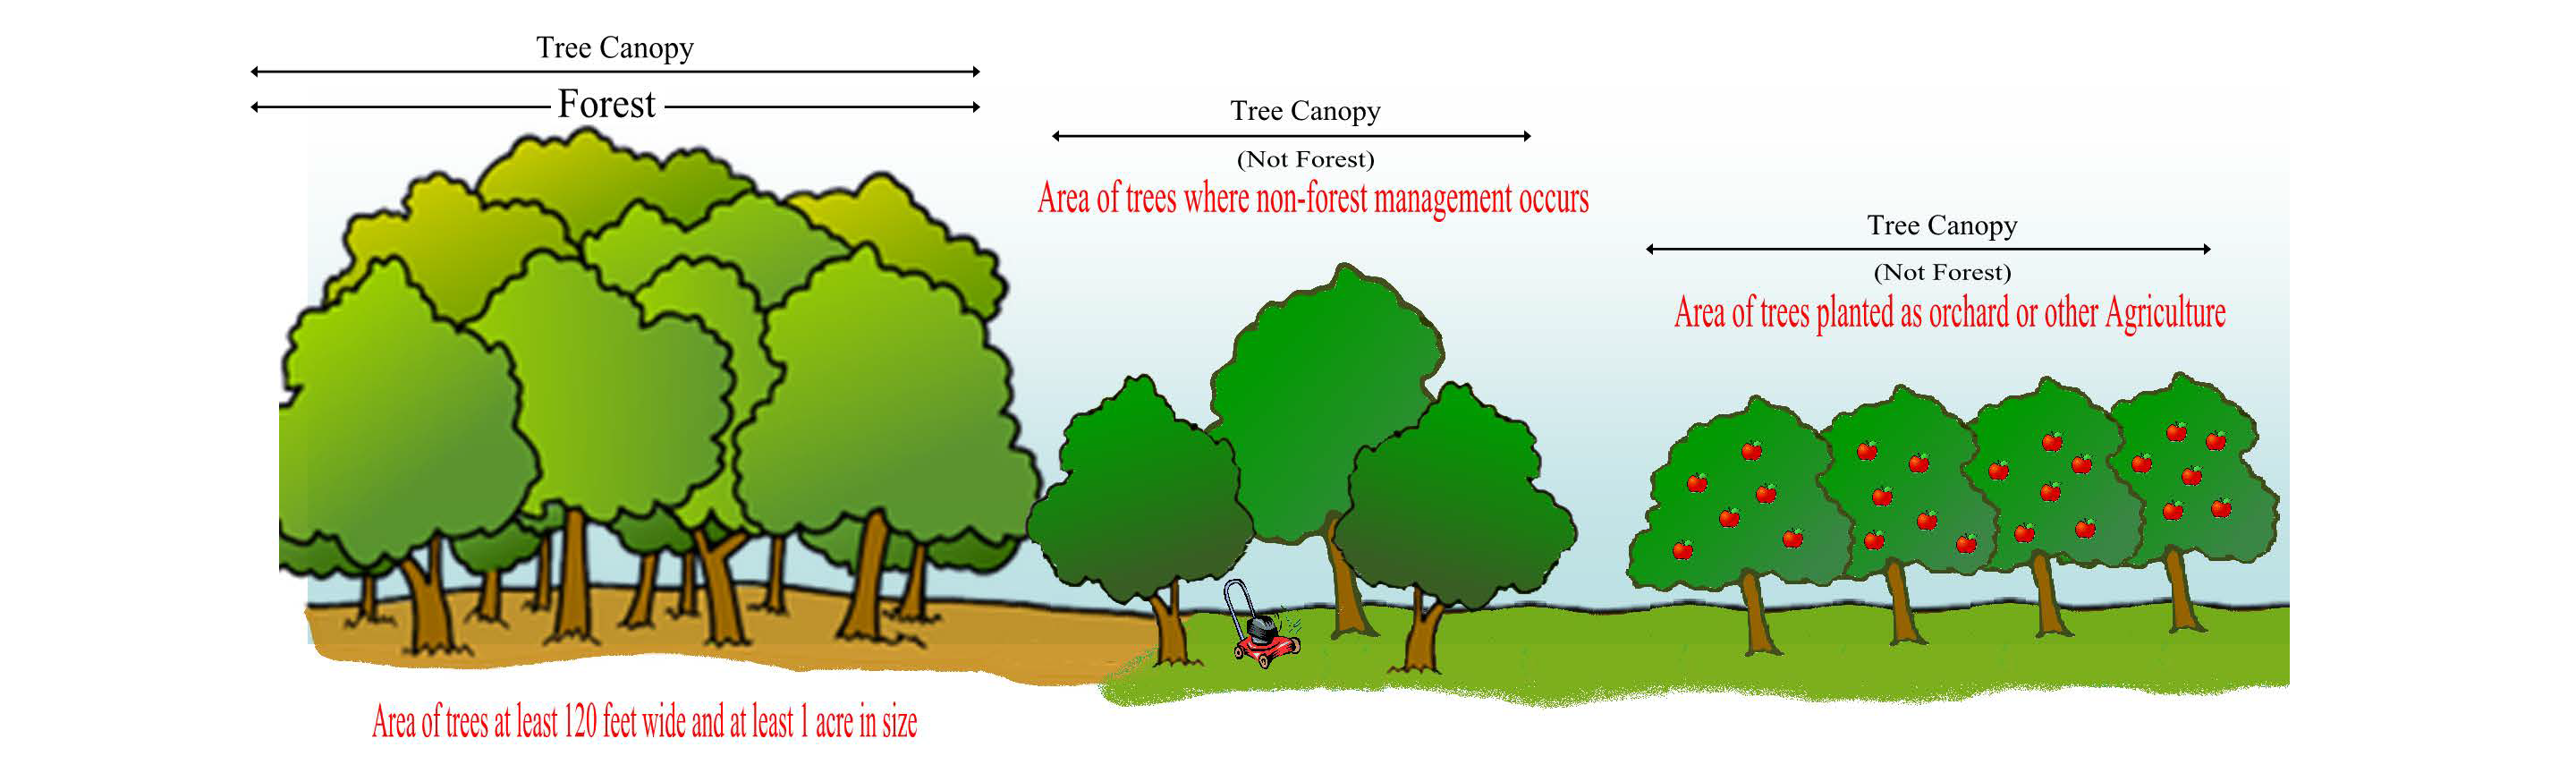
Figure 7: Shows examples of how forest and tree canopy are similar and different. The green ground represents area under trees that is mowed or grazed. Orchards and silvapasture areas are not considered forest.
US Forest Service Inventory and Analysis (FIA) Annual Summary of Permanent Plots in Maryland
Forest area from this data is estimated at 2.462 million acres in 2016 or nearly 40% of total land area.
Since 1929, the US Forest Service has been periodically collecting information about America’s forests, and this task falls to the Forest Service’s Forest Inventory and Analysis unit. The 1998 Farm Bill now requires the US Forest Service to collect data every year. This inventory is different from the digital data described above; field crews collect data from sample plots arranged across the state. It is not capable of measuring the tree canopy, but instead focuses on forest area, and collecting information about the forest.
There are over 900 permanent sample plots across the state, and the trees in these plots are measured at least every 7 years. Using statistics, the information for each plot is expanded to represent 6,000 acres of the surrounding forest. For example, if 2 of the plots were forested on a previous survey have been developed into houses, it can be interpreted as 12,000 acres of forest loss. Keep in mind, the UMD and Chesapeake Conservancy data sets are measures of tree canopy area, and FIA only measures forest. The data collected by FIA crews is invaluable, and tells us about the forest’s composition, age, structure, health, value, and much more. FIA derived data for Maryland can be accessed through the US Forest Service’s Design and Analysis Toolkit, or DATIM tool. Reports about the FIA forest sample data can be selected or created using the tool.
Additional Resources
Forests of Maryland, 2021 Snapshot (USDA-FS FIA)
National Agricultural Imagery Program (USDA)
Maryland Forest Technical Study (Chesapeake Conservancy)
