Blue Crab Summer Trawl Survey

Trawl Map of Chesapeake BayIntroduction

Blue crabs in a basket with the one on top being measured.The summer trawl survey is a fishery-independent sampling effort that the Maryland Department of Natural Resources has conducted since 1977. The survey samples river systems throughout the Maryland portion of the Chesapeake Bay to collect data on blue crab size, abundance, and distribution.  These data provide information about blue crab population trends and can be used to inform management decisions.


Methods

The summer trawl survey samples a total of 53 sites once a month from May through October.  The sample sites span across nine Maryland river systems: Chester River, Patuxent River, Choptank River, Little Choptank River, Nanticoke River, Fishing Bay, Eastern Bay, Tangier Sound, and Pocomoke Sound.  The sample sites in the Little Choptank River, Nanticoke River, and Fishing Bay were added to the survey in 2002.  These auxiliary sites are not included in the abundance indices but serve to validate observations and improve survey coverage.  

Samples are collected by towing a 16' semi-balloon otter trawl at each site for six minutes at a speed of three knots.  Once the sample is onboard, the crabs are sorted out and counted. Each crab is measured to the nearest millimeter (carapace width; CW) and weighed to the nearest gram.  Sex, maturity, molt stage, and missing limbs are also recorded.


Data and Analysis

Photo identifying crab sexes - male, immature female, mature female.Crabs caught in the trawl survey are grouped into three categories:

Recruit = All crabs smaller than 60mm (2½ in)
     * This includes males and females

Growth = Immature females bigger than 60mm
     Males between 60-119mm (2½ - 4¾ in)

Mature = All mature females

     Males bigger than 120 mm (4¾ in)


Catch per unit effort (CPUE) is used as an index of abundance and is calculated as the number of crabs per tow for each size category.  Monthly CPUEs are calculated for all crab categories and are compared to those from the previous year and the averages from 2000 to 2009.  Annual CPUEs are also calculated for growth crabs and mature females.  For growth crabs, annual CPUEs are based on the average abundance of growth crabs collected in July and August.  Only July and August indices are used to calculate annual CPUEs because small growth crabs are widely distributed throughout the Bay by July, and they molt to legal size after August, becoming susceptible to the commercial and recreational fisheries.  For mature females, annual CPUEs are based on the average abundances of mature females collected in August, September, and October.  Late summer is the period of highest mature female abundance in Maryland, after the females have grown and matured, but before they start migrating south to spawn.  ​


Results

Monthly Abundances

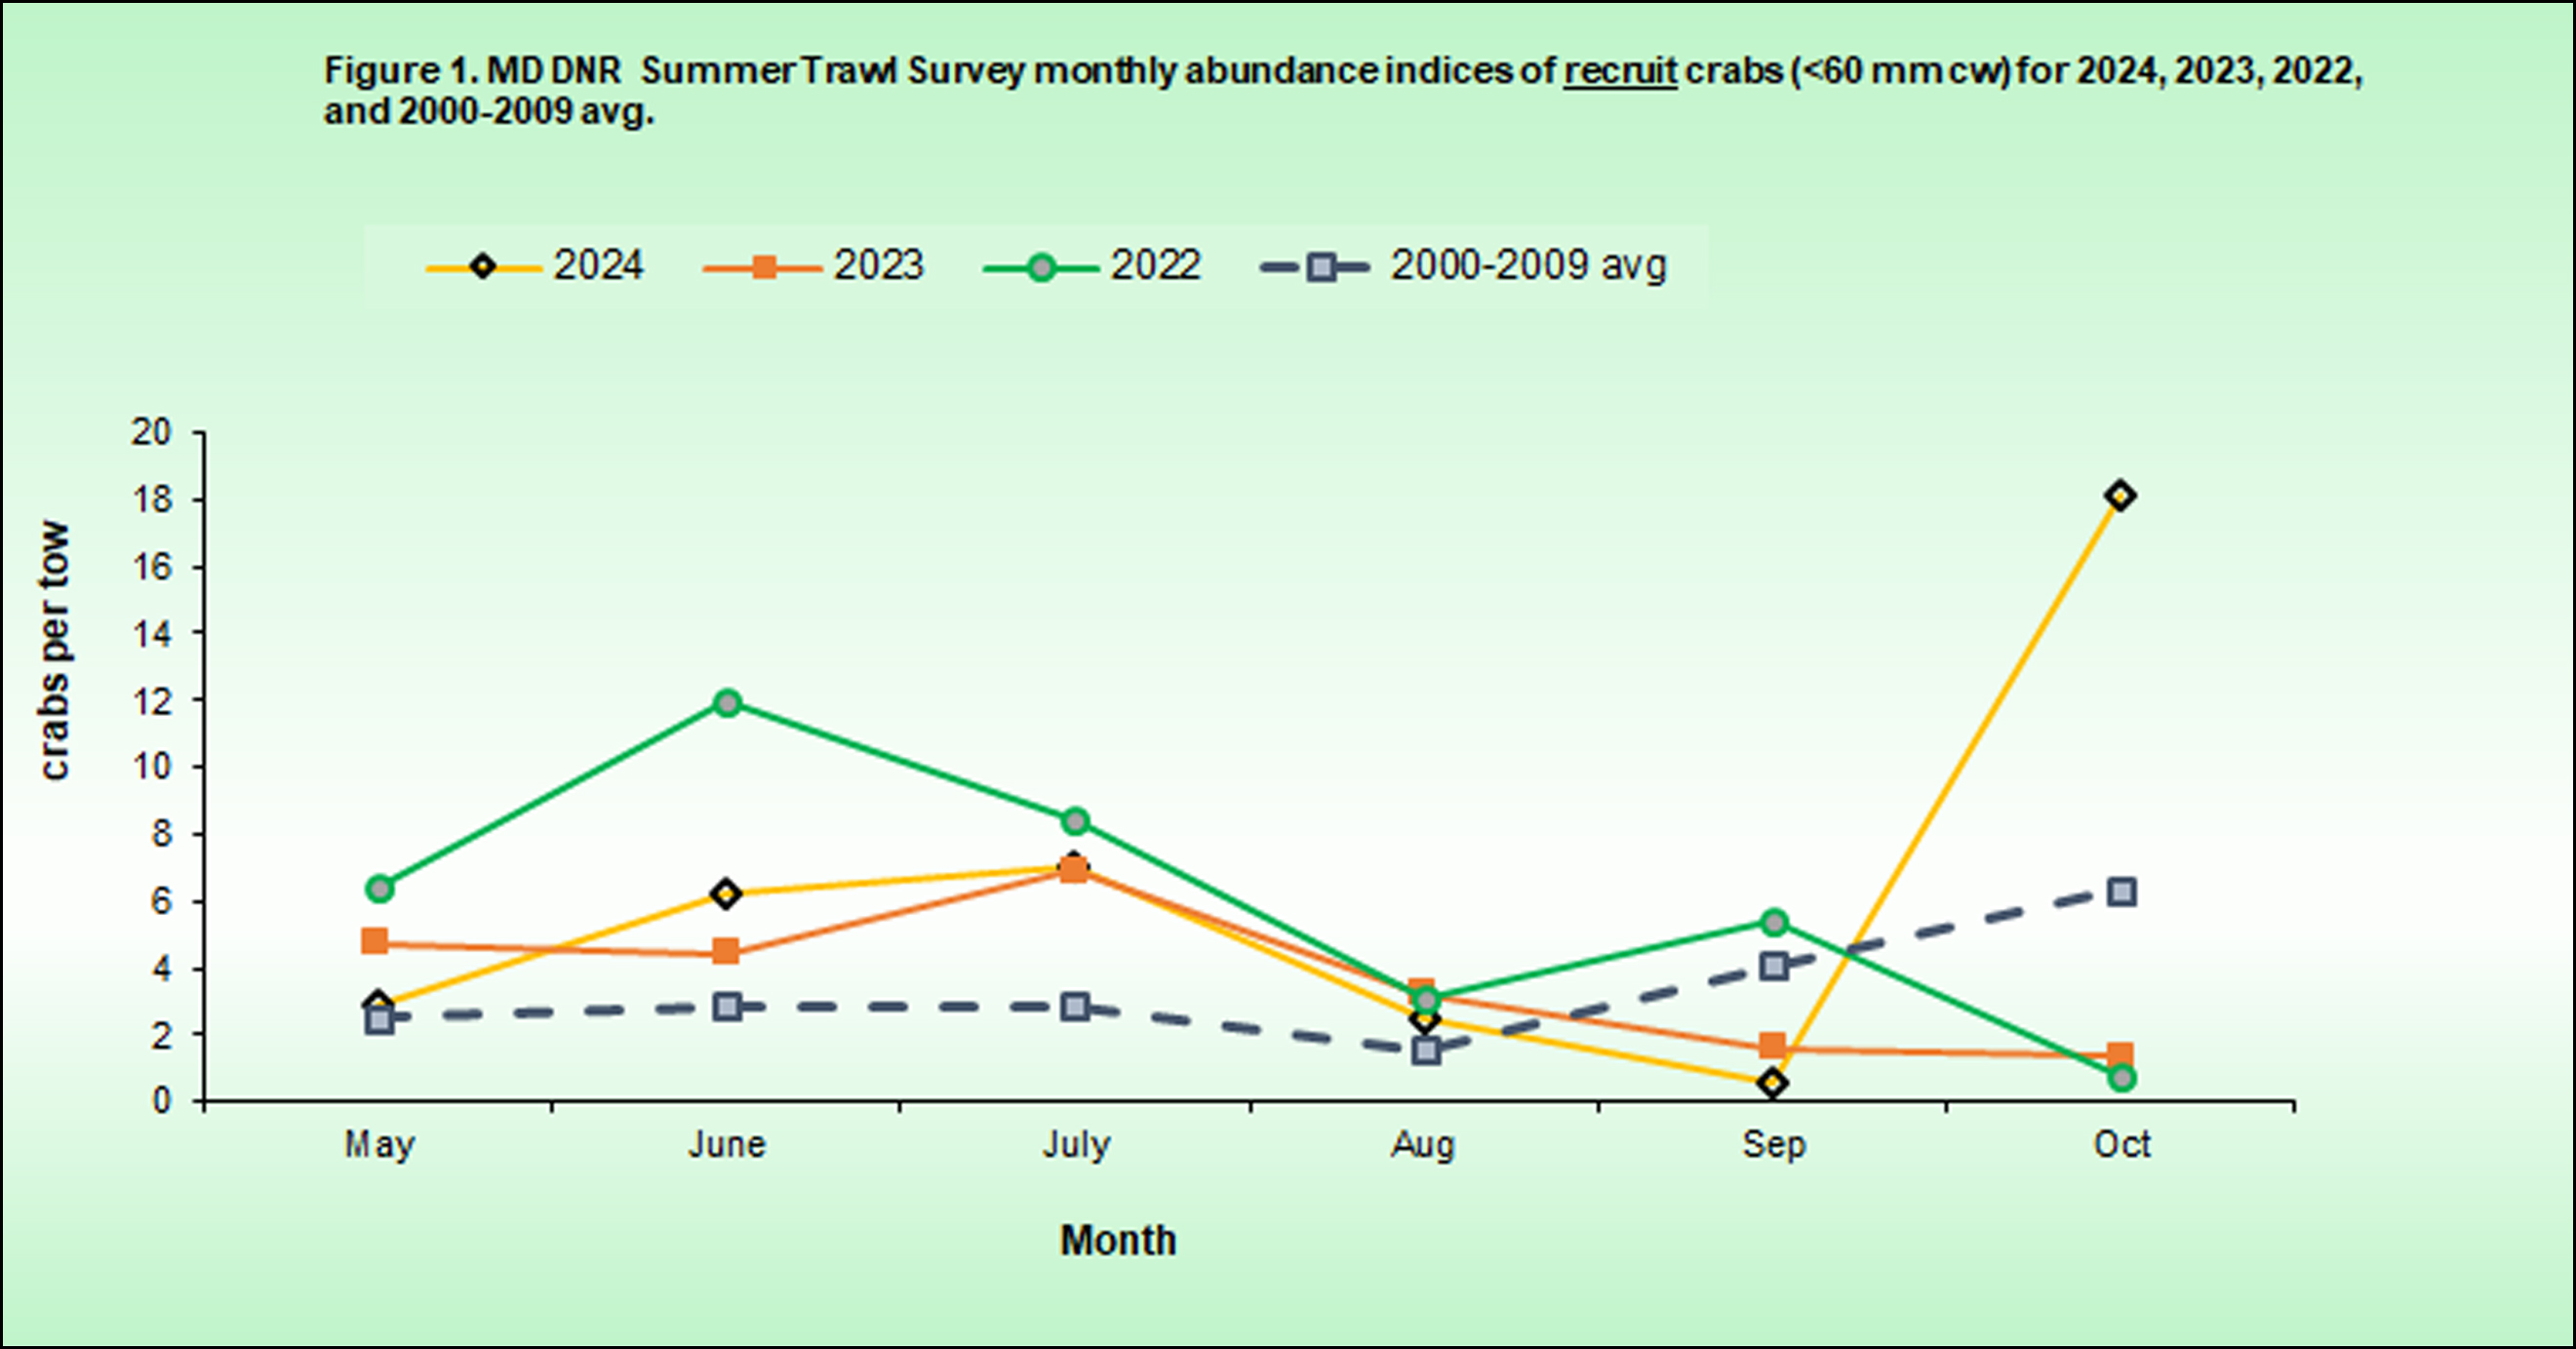
Recruit: The 2024 monthly abundance indices for recruit crabs were fairly consistent with 2023, staying below the 2022 indices and above the 2000-2009 average.  However, there was a notable increase in recruits in October 2024.  In general, recruit abundance is typically greater in the early summer, declines mid-summer, and then rebounds in the fall with the arrival of new recruits after spawning. (Figure 1)

summer trawl figure 1 


Monthly Abundance


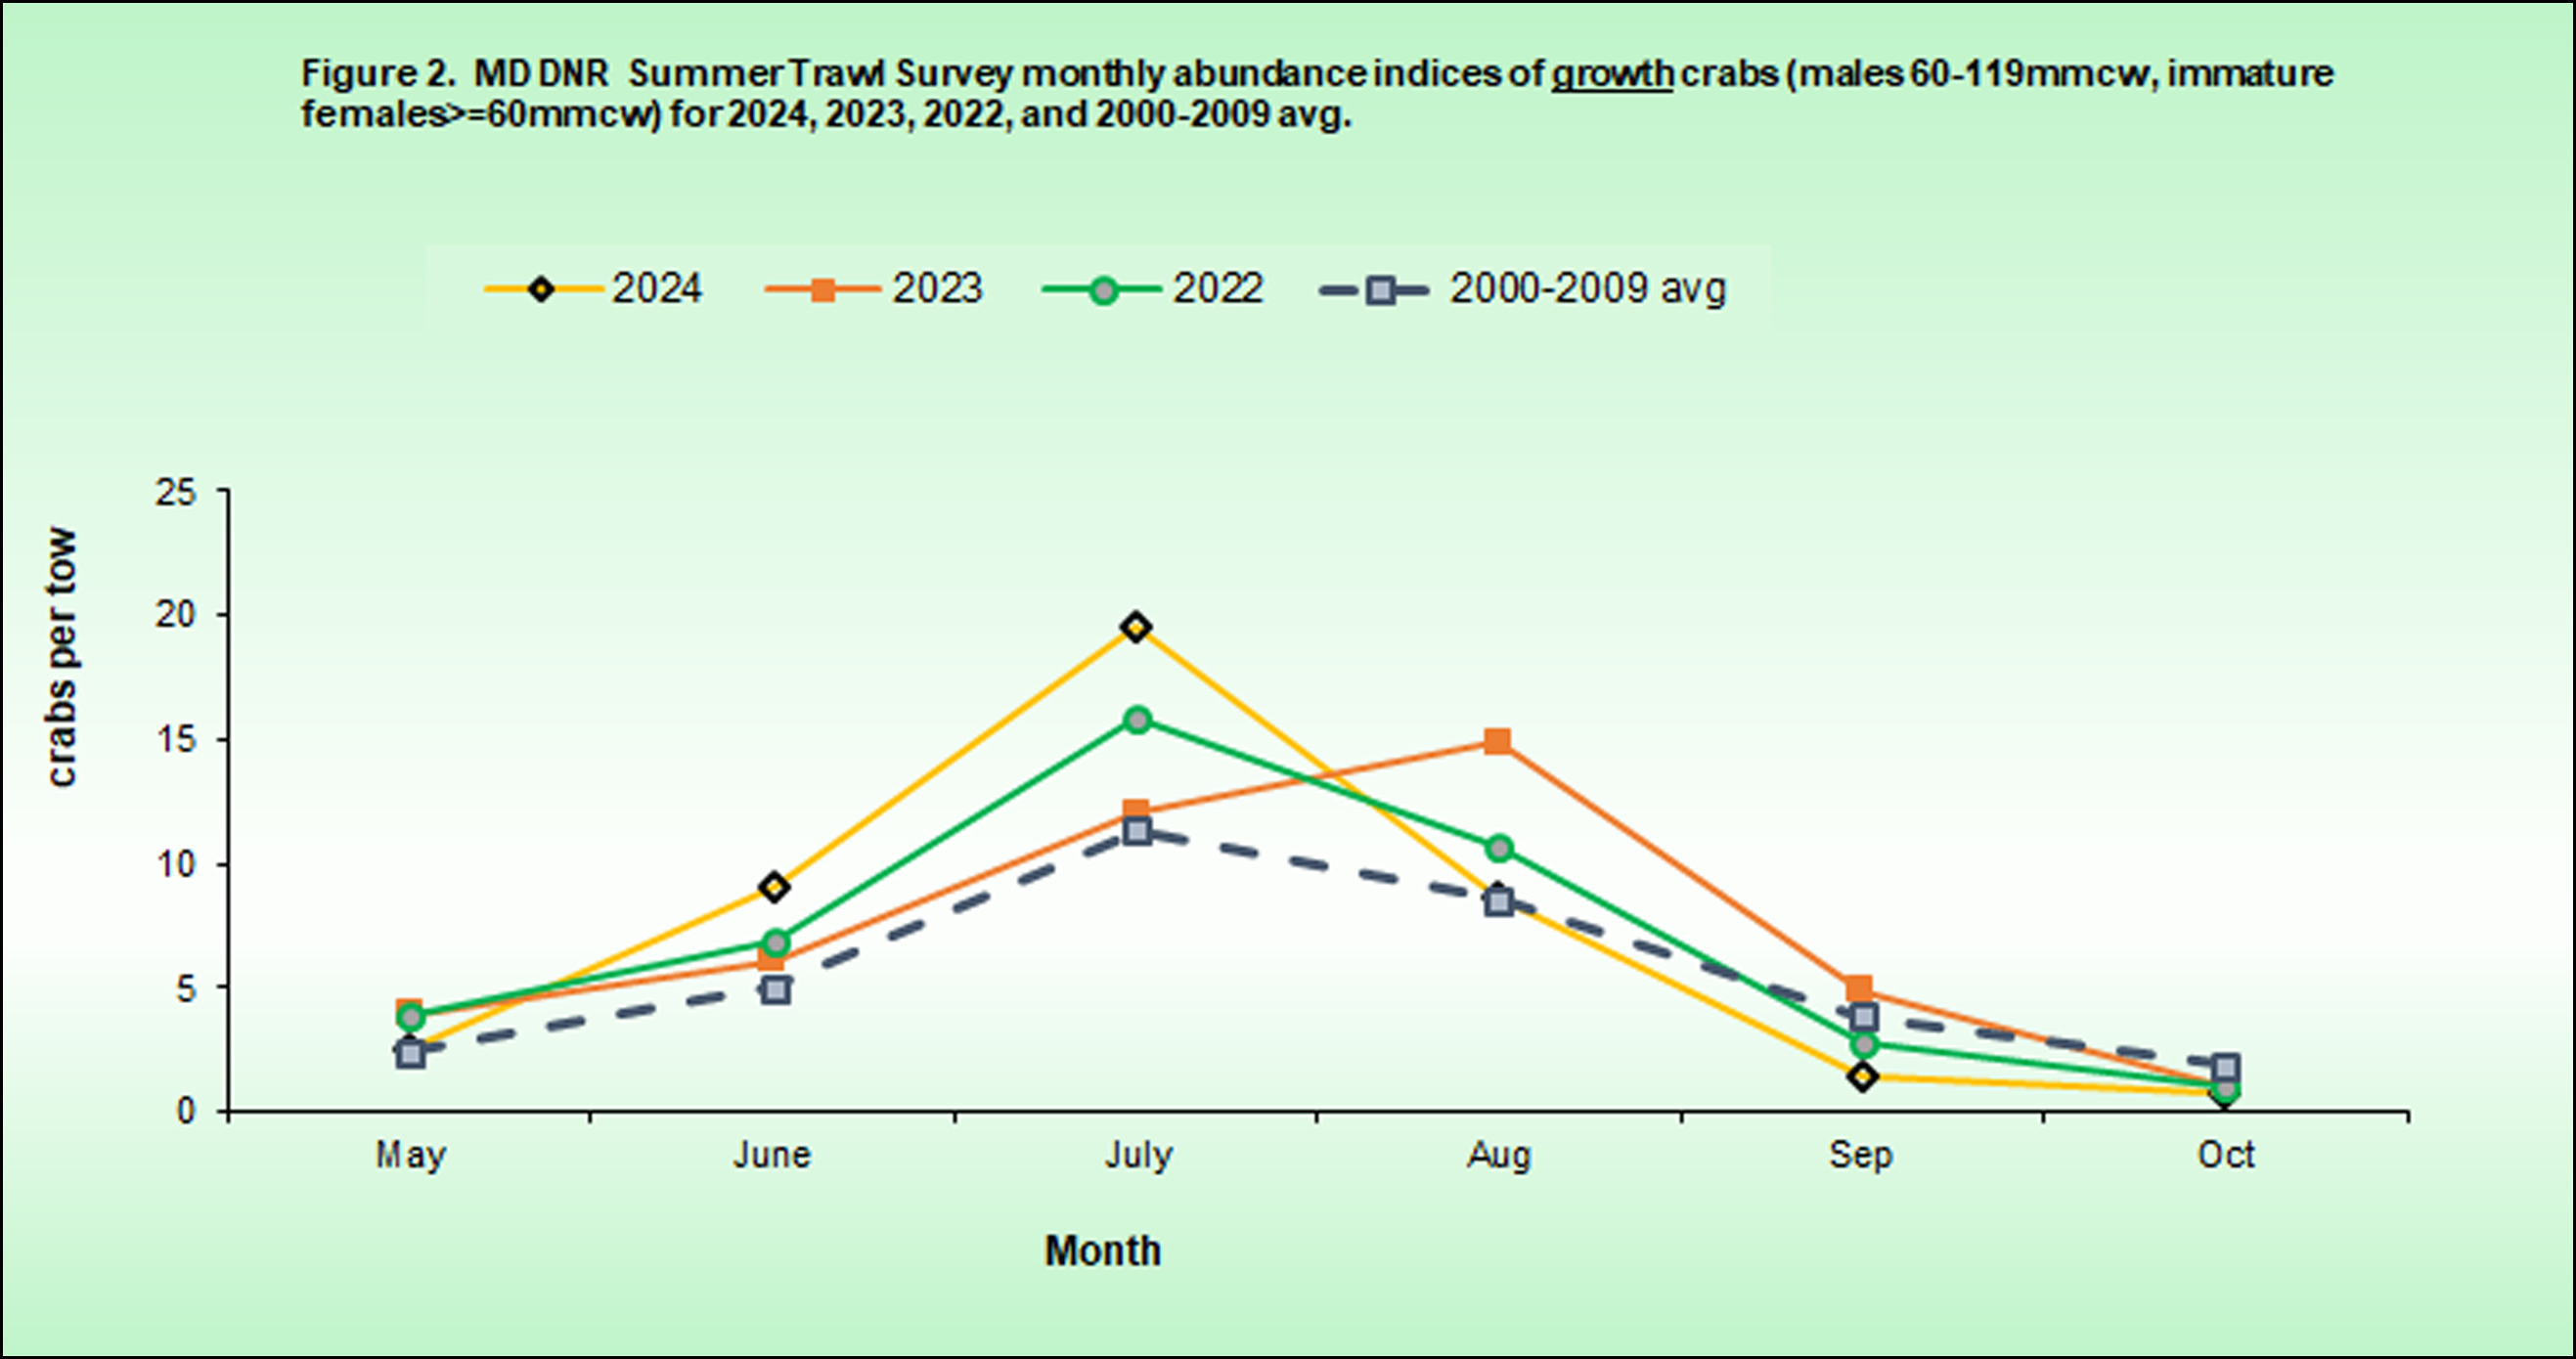
Growth: The 2024 monthly abundance indices for growth crabs continued to follow the consistent pattern seen in previous years.  Growth crab abundance increased as water temperatures warmed, reaching a peak in mid-summer, before declining again in the fall as they mature.  (Figure 2)

summer trawl figure 2 

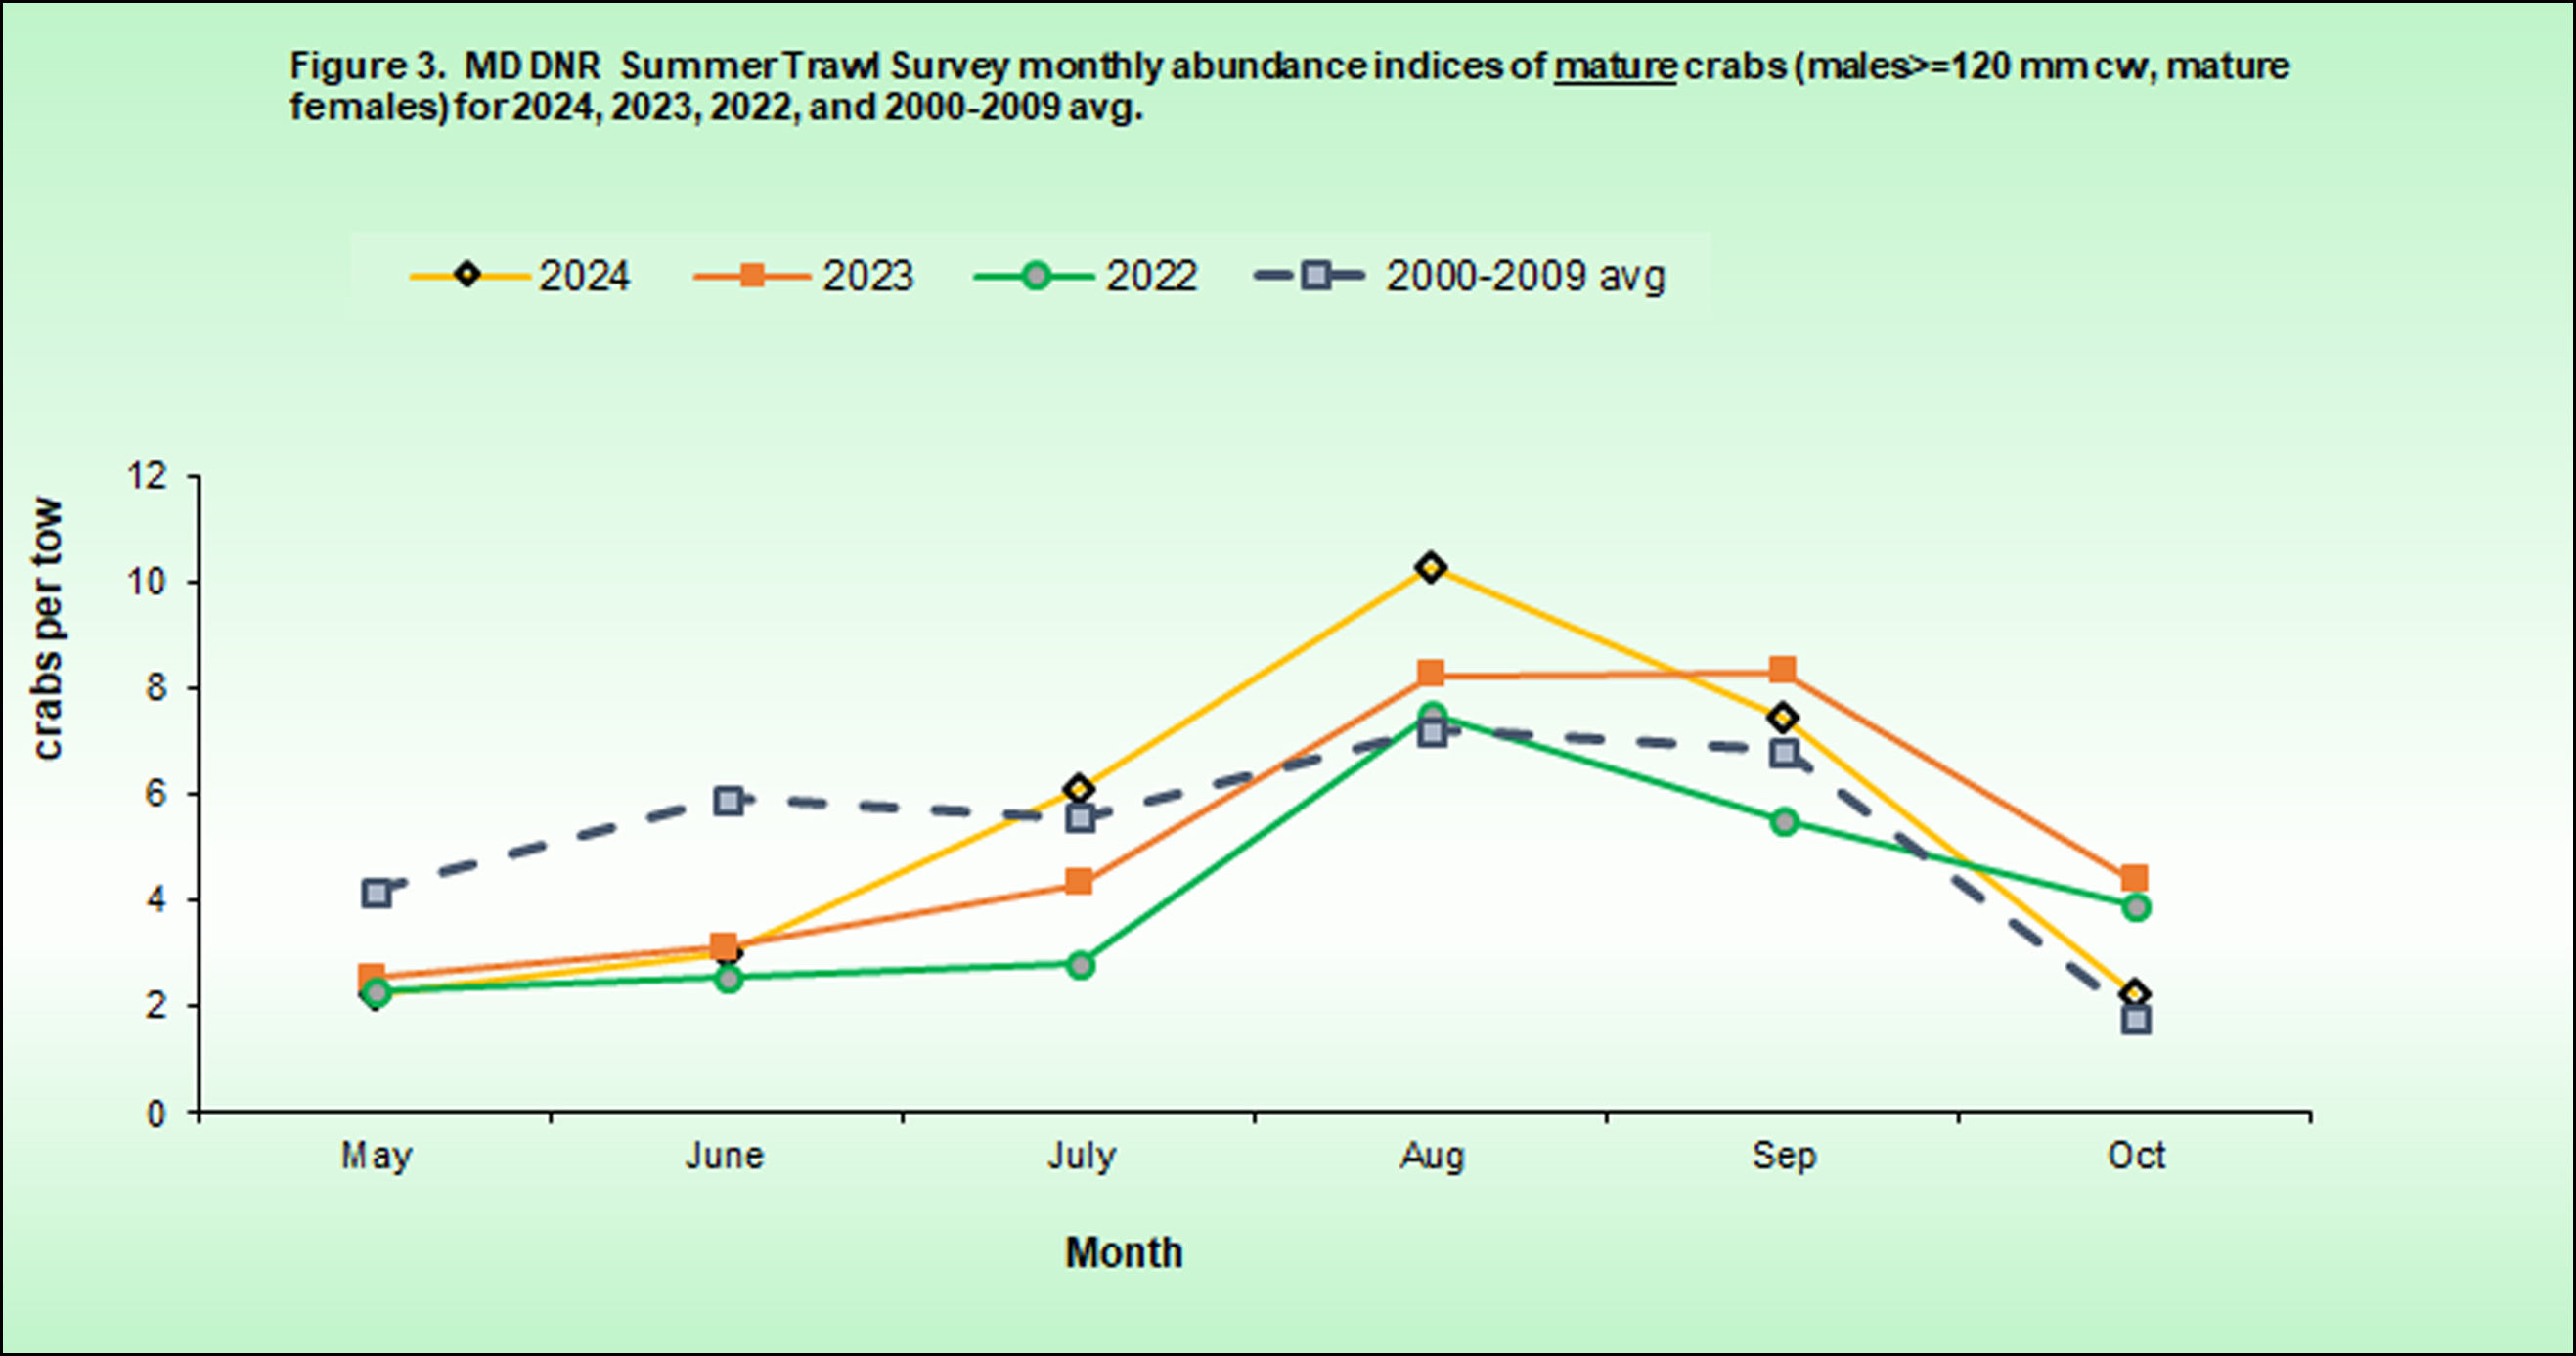
Mature: The 2024 monthly abundance indices for mature crabs also followed the traditional pattern, with lower abundance in spring and early summer as crabs are growing and then reaching the highest abundance in late summer.  Mature crab abundance decreases again in the fall as mature females migrate south to the mouth of the Chesapeake Bay to spawn.  (Figure 3)

summer trawl figure 3 


Annual Abundances​​


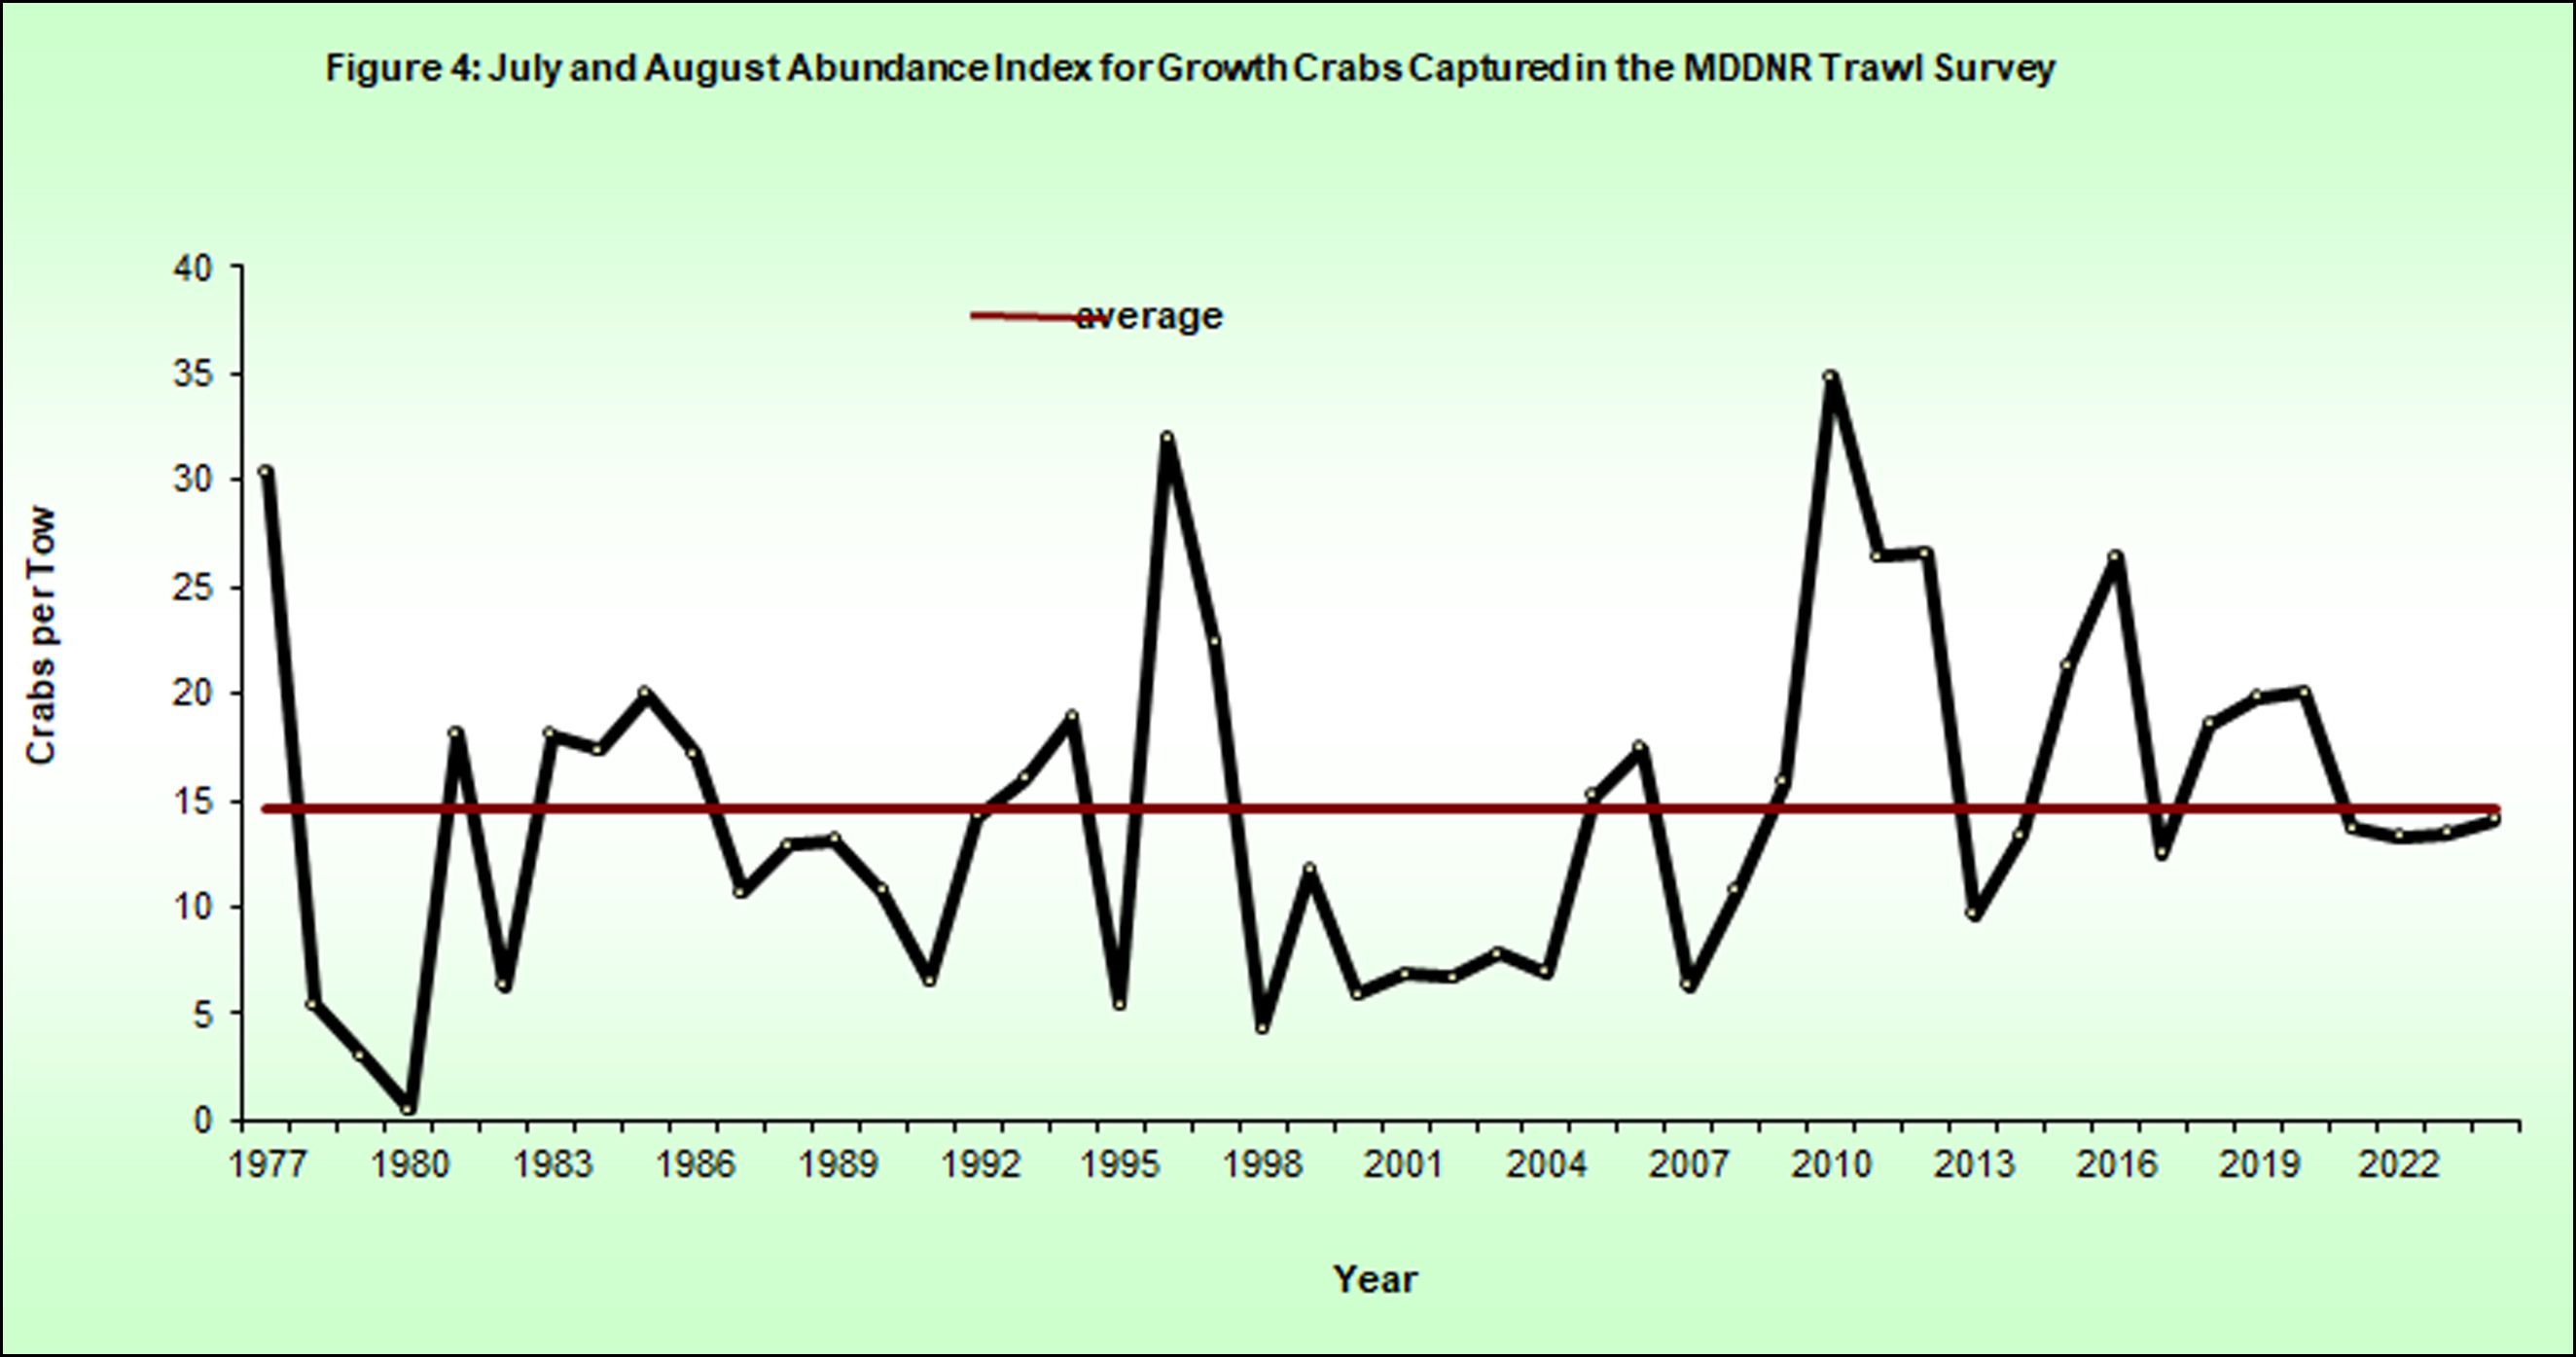
Growth: In 2024, growth crab abundance remained slightly below the survey average as seen in recent years. There have been no long-term trends in growth crab abundance since the start of the summer trawl survey in 1977. However, growth crab abundance was consistently low from 1998 to 2008. Notable peaks in abundance occurred in 1977, 1996, and 2010, and the lowest abu​ndance observed in the survey was in 1980. (Figure 4)

summer trawl figure 4  


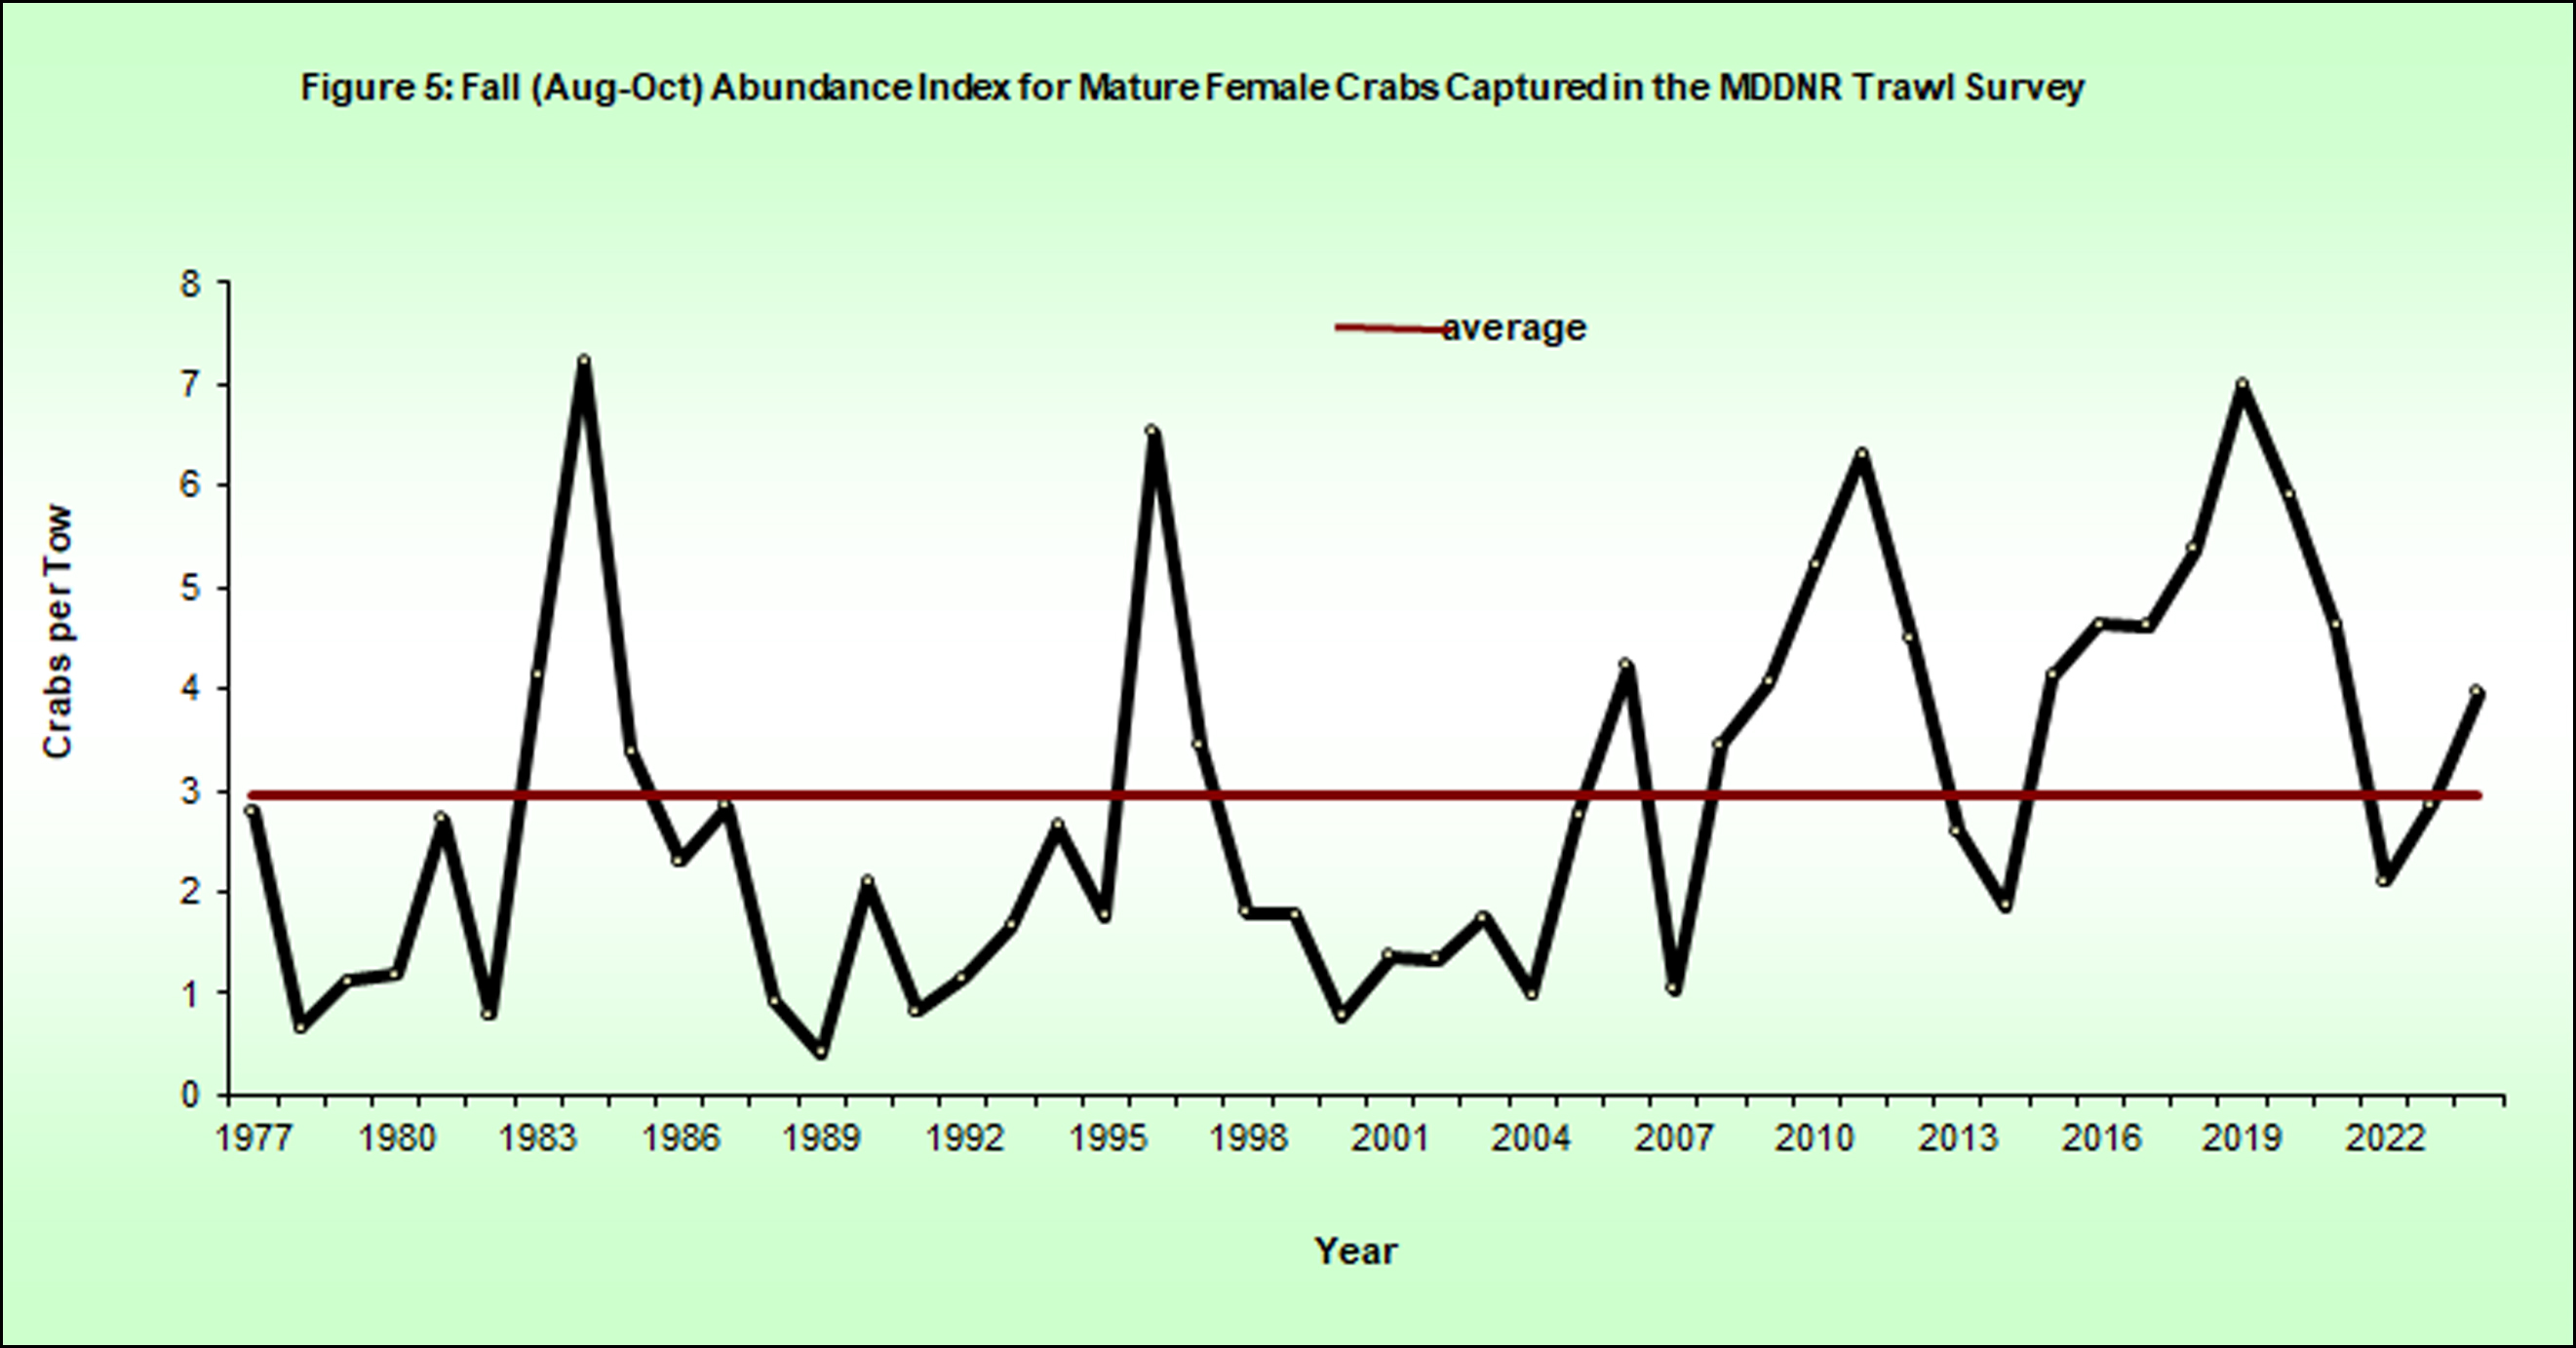
Mature Females: In 2024, mature female abundance increased above the survey average, following a similar cyclical trend seen over the time series.  Notable peaks in abundance occurred in 1984, 1996, 2011, and 2019.  Periods of lower female abundance occurred in the late 1970’s-early 80’s, the late 1980’s-mid 90’s, and late 1990’s-mid 2000s.  (Figure 5)

summer trawl figure 5 


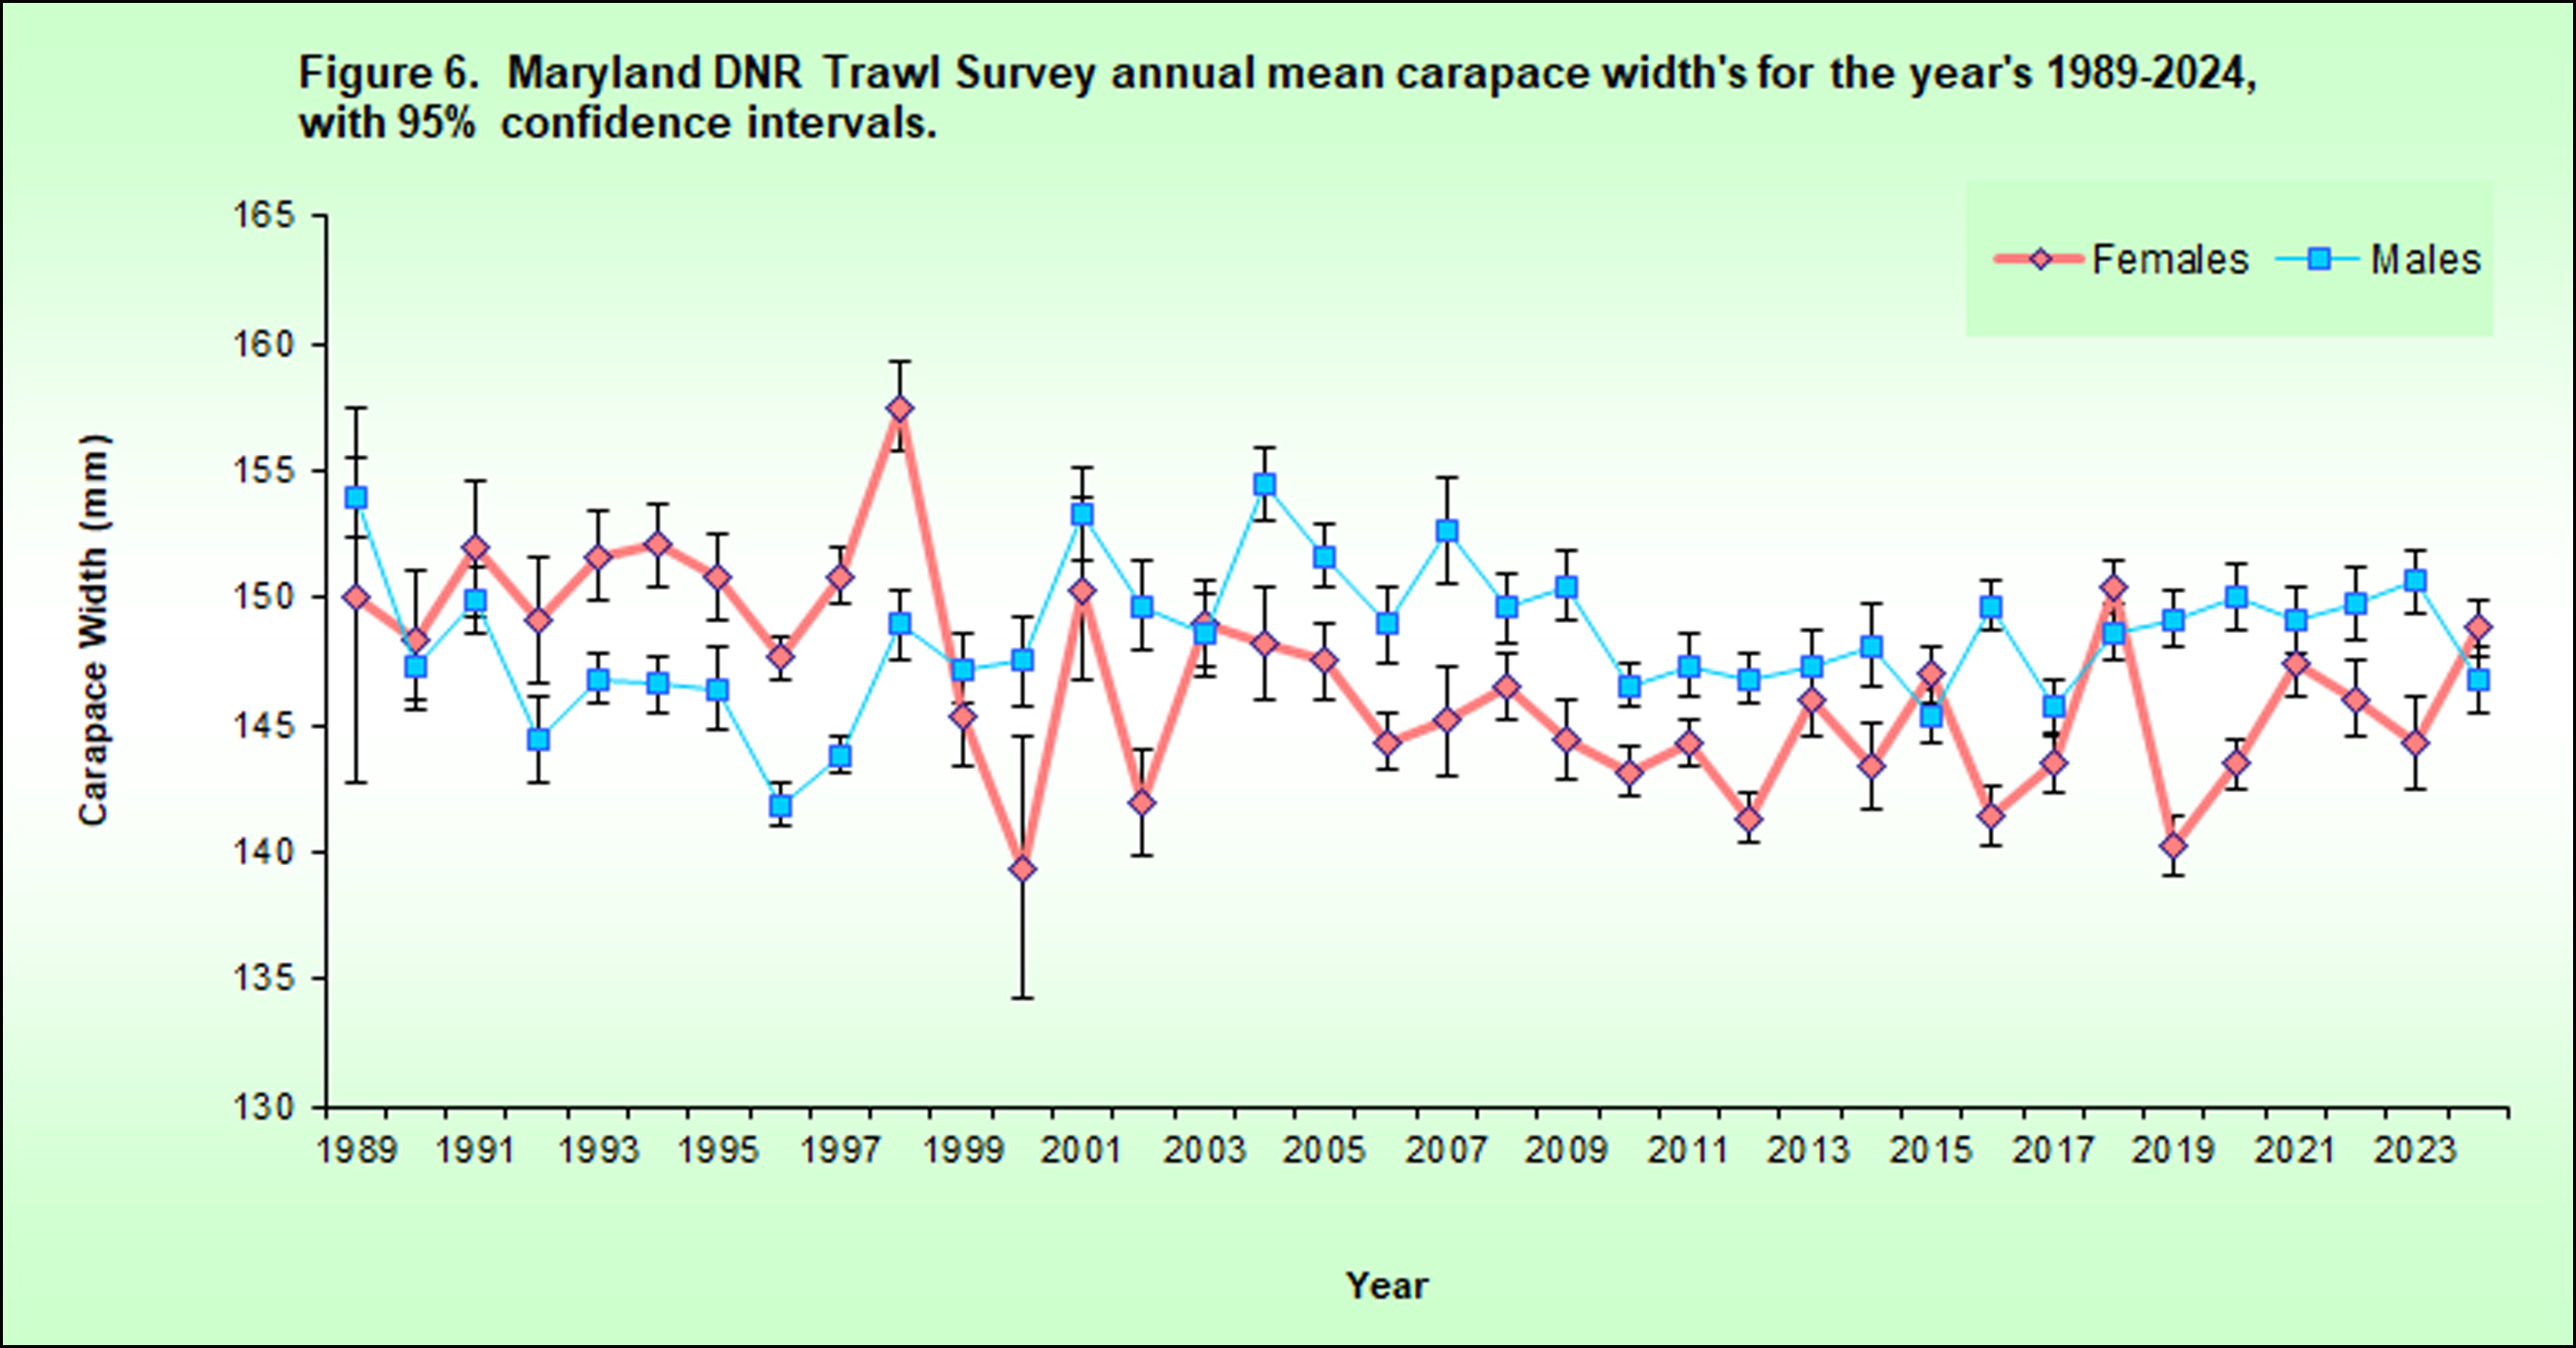
Average Carapace Width

The average carapace width of legal males and mature females is calculated using size data collected from May to October each year. The average size of legal males decreased slightly in 2024, while the average size of mature females increased.  Average crab size has varied throughout the time series for both males and females, but the long-term average has been relatively constant.  (Figure 6)​

summer trawl figure 6​​​​​